
Proofpoint Actionable Insights are the additional metrics and insights that the Proofpoint Threat Protection Platform can deliver through our combined data, detection and research. These insights provide the additional detail and context you need to fully understand your threats—and how to defend against them effectively.
In the first three posts of our “Actionable Insights” blog series, we focused on specific insights—people risk, origin risk and business email compromise (BEC) risk—and the actions you could take from them to enhance your overall cybersecurity posture. In this post, we’d like to take a step back from the strict numbers and insights and talk about the importance of having context around your metrics and how to find this additional context in the Proofpoint Targeted Attack Protection (TAP) Threat Insight Dashboard.
Gain a deeper understanding of your threats through context
As we dig into the actionable insights available in the TAP Threat Insight Dashboard, it’s important to note that as straightforward as many insights may seem, the value of those insights can often be limited, or even incorrect, if the person interpreting them doesn’t have the proper context. Context enables analysts to better understand the real story behind the data.
You can add context to your reporting with either internal benchmarks and trend analyses, or by comparing your own data with external data sources. It’s one thing to gain valuable insights into your own threats, set your own benchmarks and then focus on internal growth, but even if you do make improvements, how do you know if you’re doing enough?
Having the proper context can help you understand if your efforts are enough, re-prioritise your actions when needed, add a sense of urgency and aid the decision-making process. Context is an effective way to measure how your organisation is performing and to communicate the importance of new insights that the numbers alone cannot.
Insights
How does our threat activity compare with the activity that similar organisations face?
The industry comparison report can help you answer the question above. It provides some of the most valuable context for helping you understand your threats and how they compare with what other organisations within related industries are experiencing. This report can show the types of cyber attacks, their severity and how much each type is affecting your organisation.
You may be able to see, for example, that your overall risk isn’t particularly high—but perhaps one type of risk is affecting you disproportionately compared to peers in your industry.
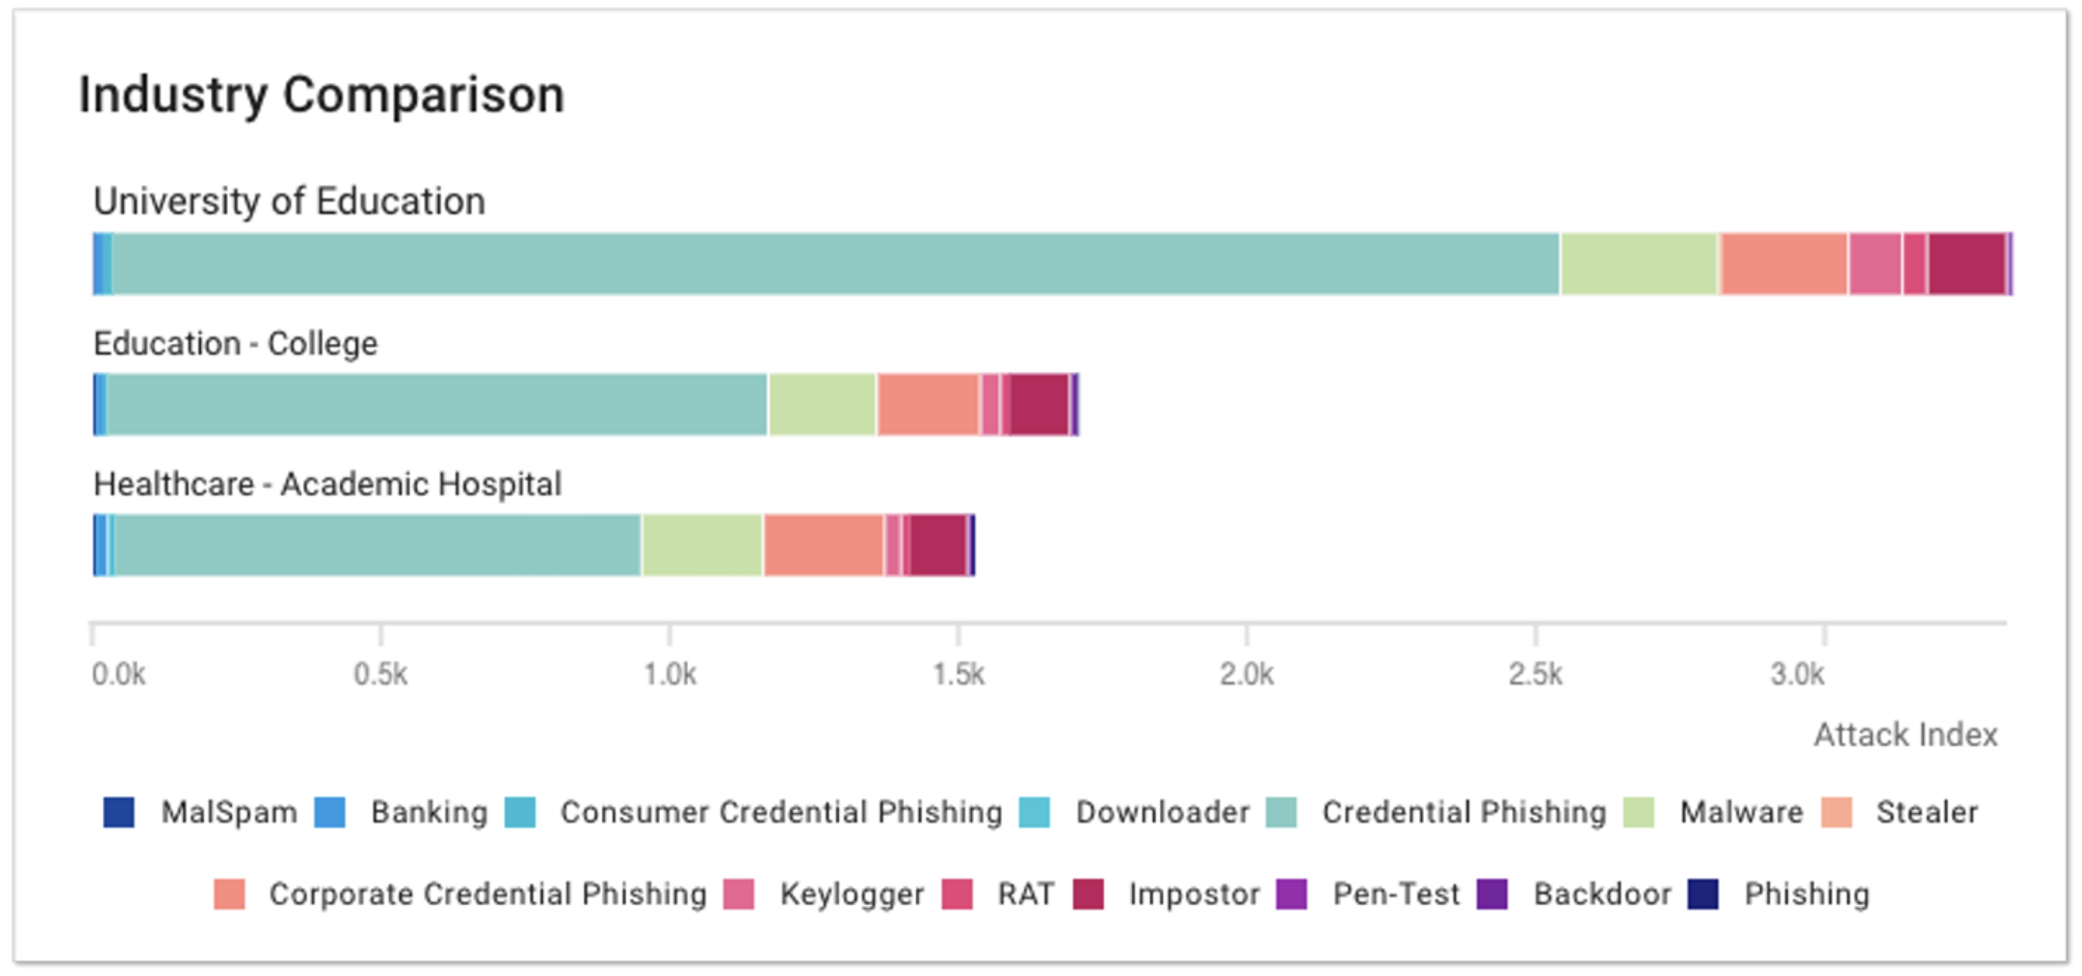
Figure 1. Industry Comparison report showing threat types and severity.
You can use the Industry Comparison report found within the TAP Threat Insight Dashboard for multiple different metrics. The report in Figure 2, for example, shows the percentage of threats from each threat objective and how that compares with similar industries.
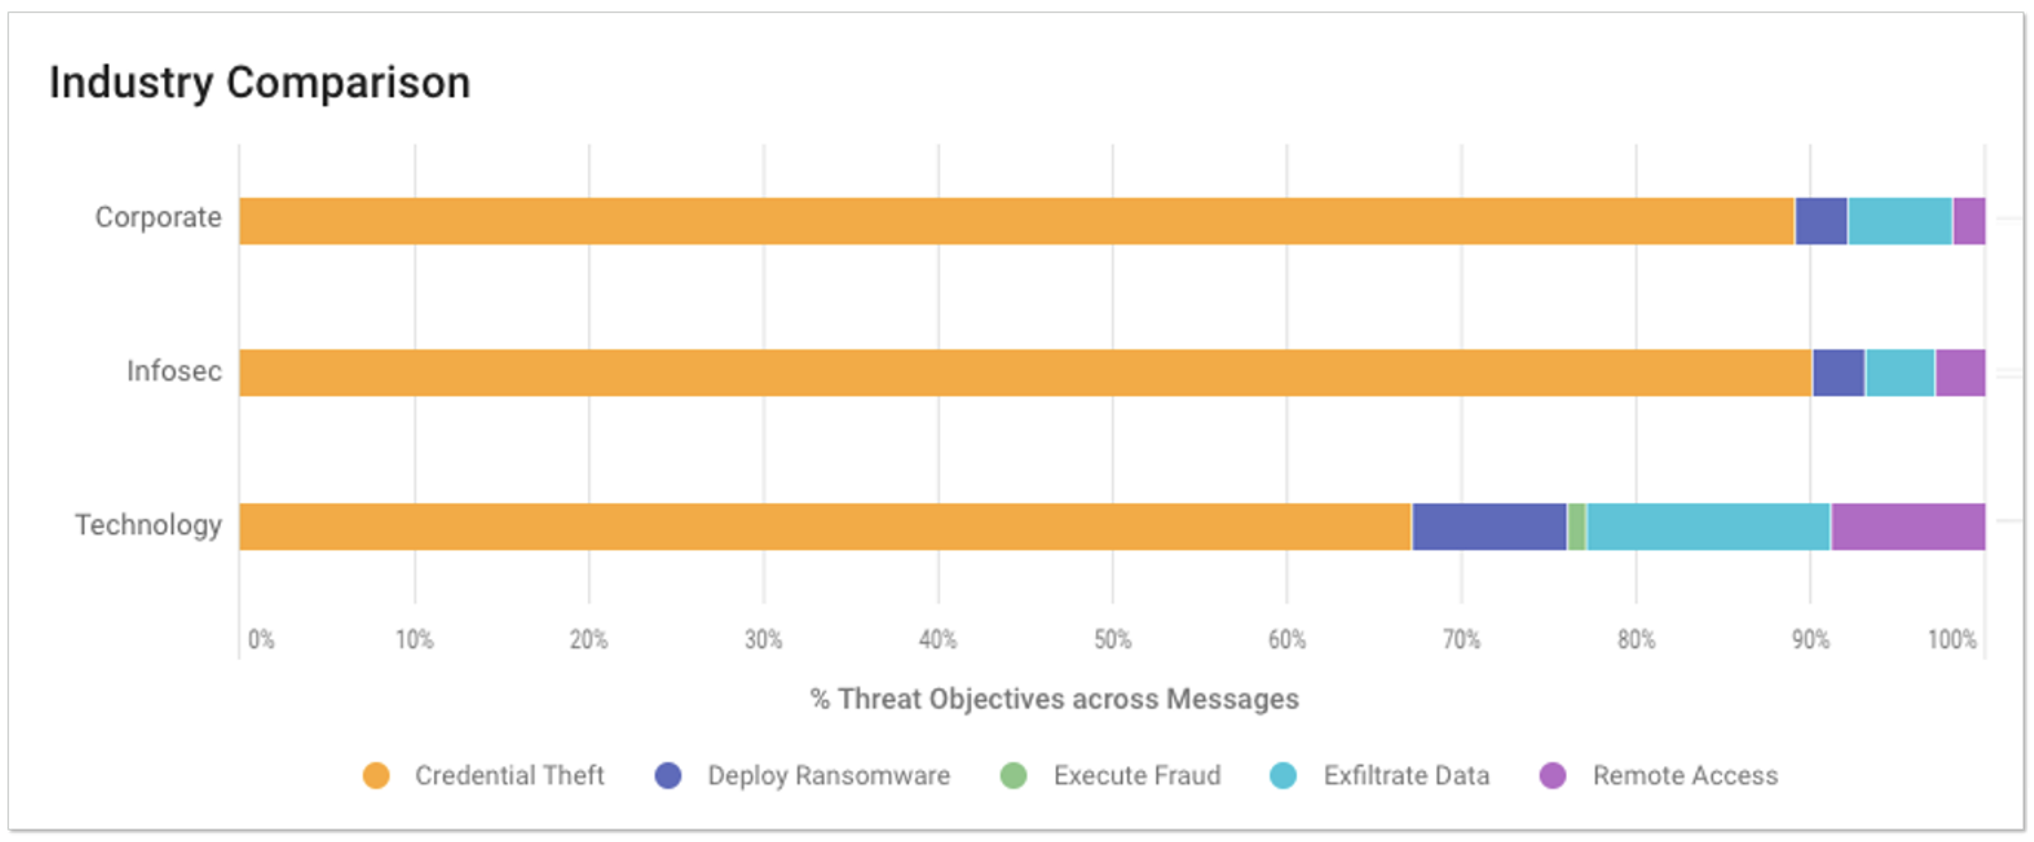
Figure 2. Industry Comparison report showing percentage of threat objectives.
How have our threats changed over time?
Trend reports can also be found throughout the TAP Threat Insight Dashboard. They can help you understand if your attack volume is normal or not, or whether a more targeted attack may be occurring.
For example, it’s one thing to have a report that shows the number of attacks for a certain time period with a breakdown of how often each type of threat objective was used. However, a Threat Objectives Trend report, like the one in Figure 3, lets us know if those numbers are higher or lower than normal. It also allows us to understand if overall threats, or different threat objectives, are increasing or decreasing over time. In short, the Threat Objectives Trend report helps answer the question, “Are the efforts we’re making having an effect?”
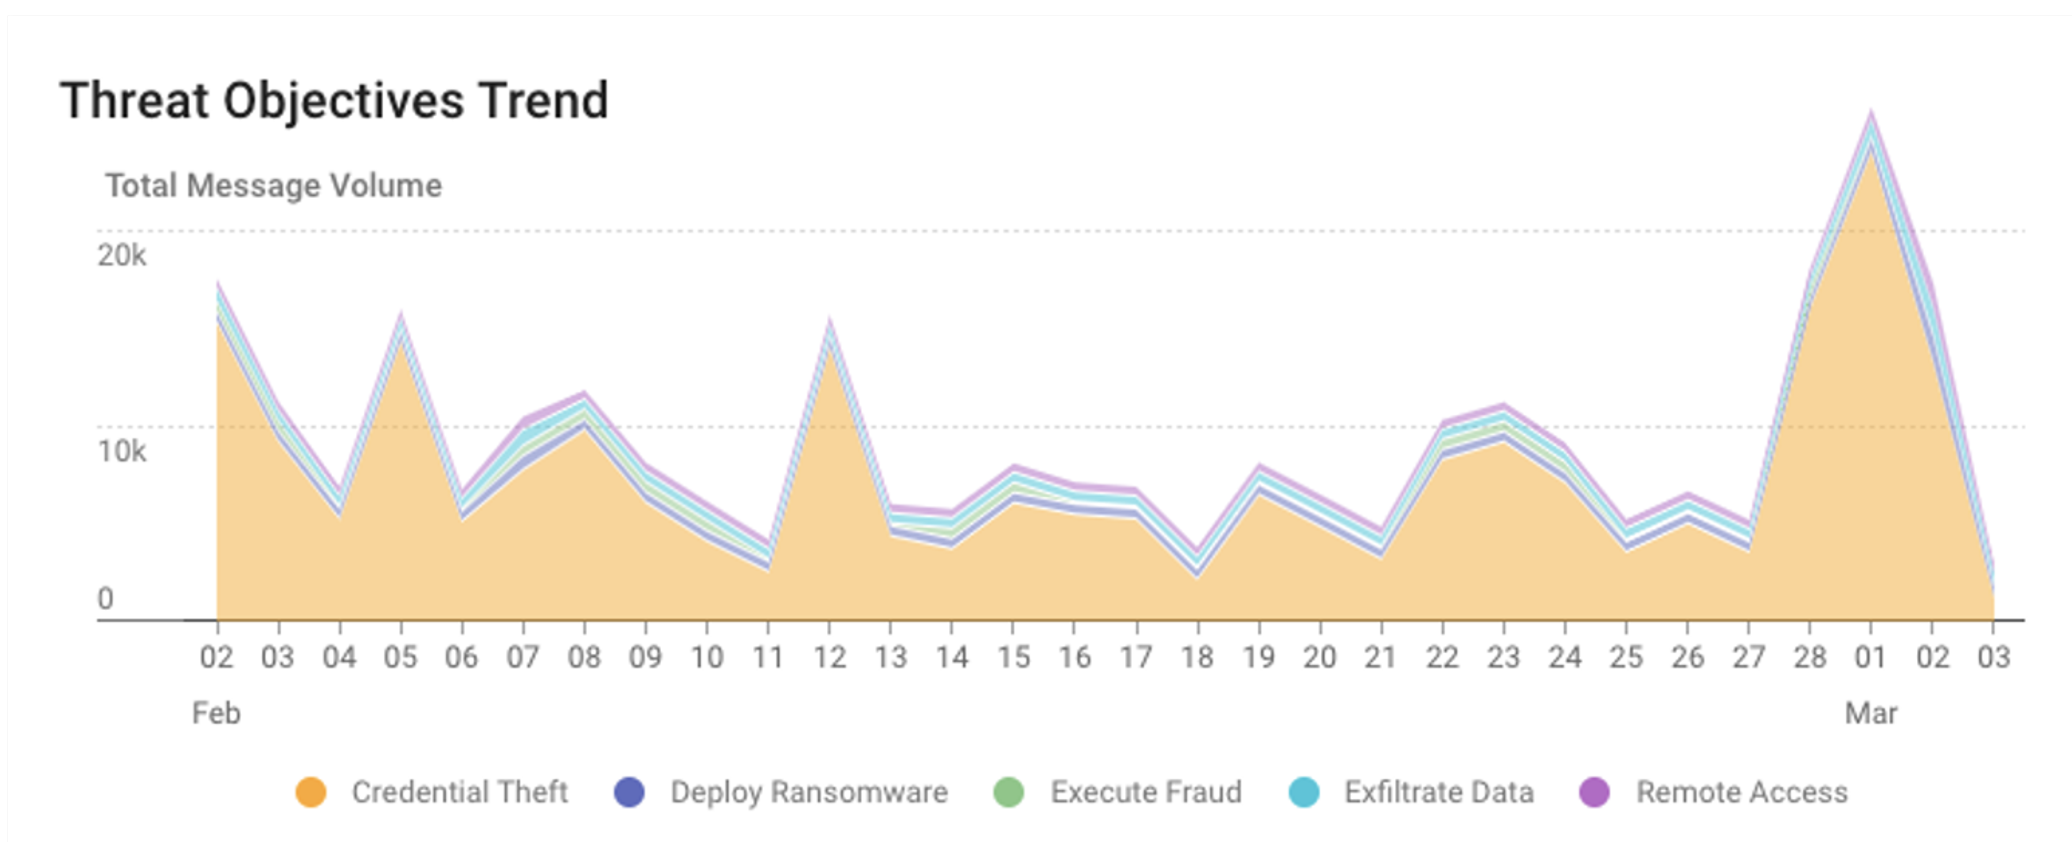
Figure 3. Threat Objectives Trend report showing threat types over time.
This report can also help you to identify spikes in activity that may represent a targeted attack. In the report example shown above, there is a significant spike in activity around March 1, especially around credential theft. This insight can provide the additional context you may need to investigate this issue and better protect your organisation in the future.
How effective has our protection been over time?
The Messages Protected Trend report shows the volume of protected messages over time. It allows you to see not only how current numbers compare to historical numbers, but also how well you’ve been protected pre- and post-delivery—as well as any messages where you might have been exposed.
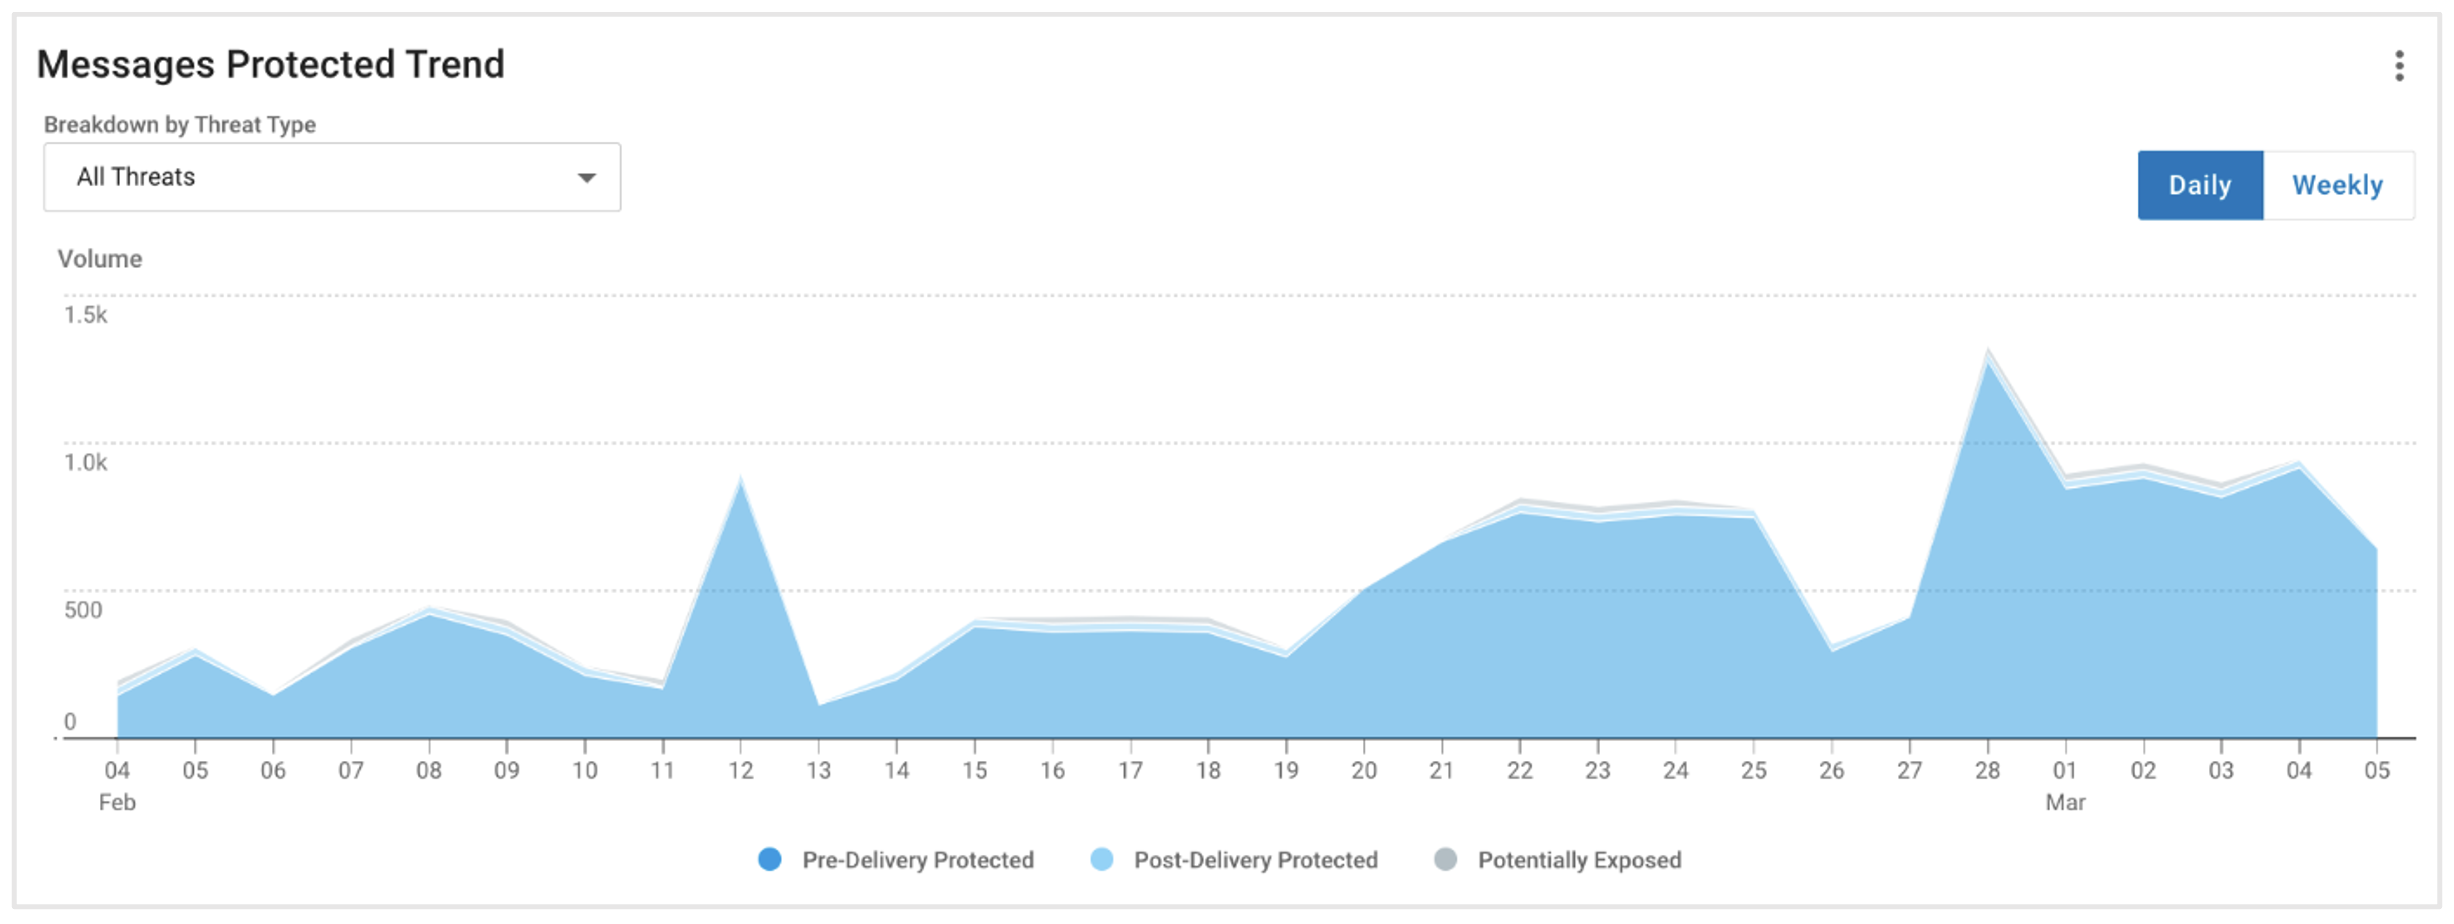
Figure 4. Chart showing the Messages Protected Trend by TAP.
Targeted controls
Adding context to your threat reporting can provide more accurate and richer insights to inform downstream controls that you can implement to improve your security posture. It helps you to:
1. Prioritise your efforts
Understanding not only your own threats, but those of others, can help you recognise certain attack types or objectives that may be affecting you disproportionately.
For example, you may have lowered your credential phishing attacks by a certain percentage, which looks good against internal benchmarks. However, in the Industry Comparison report, you can see that you still receive almost twice as many attacks as other organisations. This understanding allows you to deploy your finite resources to the most important projects.
2. Remediate more quickly
Adding context through trend graphs can help you recognise a targeted attack and deploy resources immediately to that specific threat activity to remediate the issue faster.
Other benefits
Contextualising risks can also help you to:
- Demonstrate and track the value of your organisation’s email security team and tools, measured in terms of threats defended and reduced business risk.
- Understand industry comparisons; this will help security teams spend their limited resources on the most impactful actions by focusing on threats that affect them the most.
Understand the biggest risks to your organisation
If you’d like help identifying the most significant digital threats to your business, reach out to Proofpoint for a free Digital Risk Assessment. One of our security experts will conduct this assessment, helping you add context to some of the biggest threats to your organisation and showing you how to mitigate them.
Learn more about the TAP Threat Insight Dashboard and Actionable Insights from Proofpoint here.