
Click rate. Also known as failure rate. It’s the first and primary statistic we hear about from customers who are measuring the effectiveness of a security awareness program. And it’s an important stat to keep an eye on during your program. But it’s not the only metric you should be tracking.
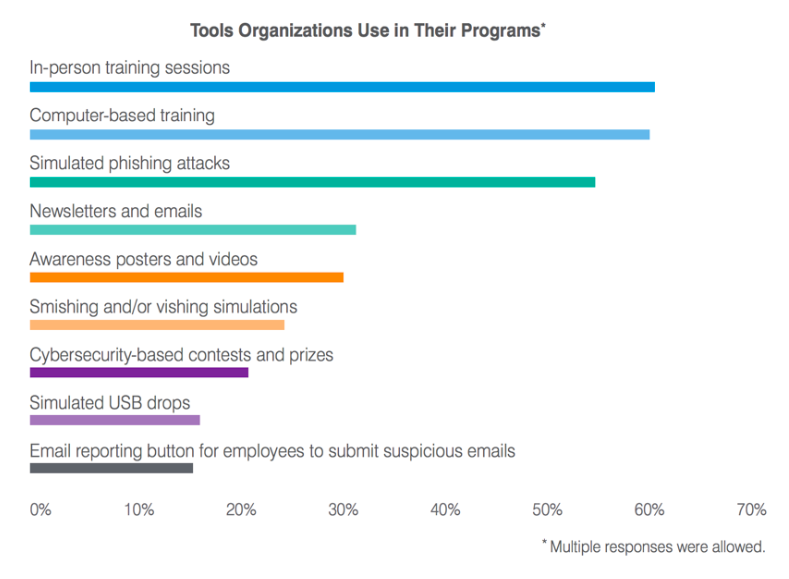
Infosec survey results from 2020 State of the Phish report
As we learned from our 2020 State of the Phish report, email reporting add-ins are an under-utilized component of security awareness training. According to our survey of IT and infosec pros, only 15% of organizations are utilizing a tool like this in their programs. With most vendors’ email reporting add-ins, you’ll be able to measure a “reporting rate.” This is defined as the percentage of users who receive a simulated phishing email and report it using one of these tools.
Our data found there is more variability in the reporting rate compared with the click rate, and that reporting rate is a better overall indicator of user behavior change because of the variance.
Another stat that can be utilized by administrators is knowledge levels. While click rate and reporting rate are sufficient metrics to measure user resilience to phishing attacks, knowledge levels from assessments ensure users understand skills related to phishing and expand to topics like data privacy, passwords, mobile security, and more. For instance, if you have a highly-regulated organization or department that requires specific training, understanding these knowledge levels and if they’re improving or degrading will become essential.
Benchmarking Click and Reporting Rates
If you send out a simulated phishing email, what is considered a “good” click rate? The answer largely relies on how difficult and targeted the simulated phish was, as well as how experienced your users are. As you send different phishing templates, variability should be expected.
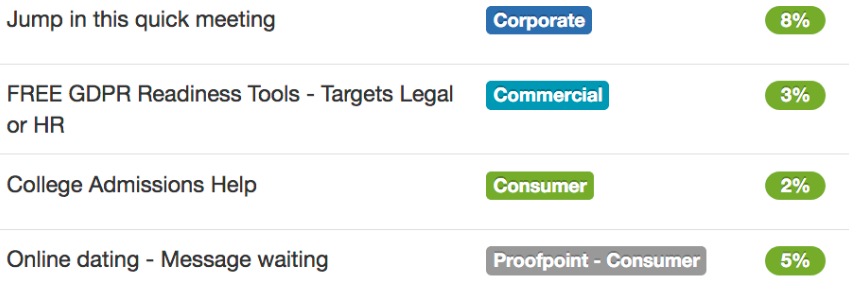
Average Failure Rates (AFR) from our ThreatSim®
Our general rule of thumb for click/failure rate is that under 5% is good, but a more accurate measure is how much “under” or “above” a template it compared to the average failure rate, or AFR. A lot of vendors, ourselves included, will provide the AFR of different simulated phishing templates, like shown above with the green number. As you can see, having a click rate of 5% for certain templates demonstrates a lower-than-average score across our customer base. That’s why we emphasize comparing results to these AFRs for better insight into user phishing awareness. One important note is that AFRs can change over time as more organizations utilize templates.
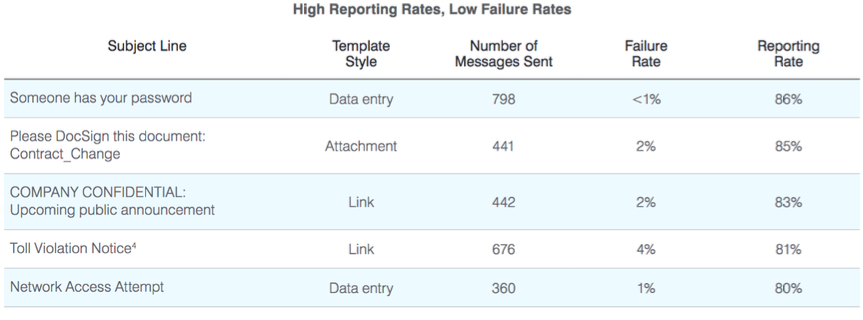
Anonymized Customer Reporting and Failure Rates from the 2020 State of the Phish report
To take it a step further, how do you benchmark reporting rates of simulated phishing emails? A good rule of thumb is to aim for at least 70% reporting rate from users. We found several of our customers were able to achieve greater than 80% reporting rates and a very low failure rate.
Positive Externalities of Your Security Awareness Program
Security awareness reporting is important in the context of the statistics and key performance indicators (KPIs) you’ll most-likely view within your security awareness software, but there are other internal metrics that are good to track:
- Number of malware infections and user machine remediations
- Time and resources spent on abuse mailbox management
- Number of successful phishing attacks from the wild
- Downtime hours for end users
One of the main reasons we recommend tracking these metrics is they’ll help you get continued buy-in for your program from key stakeholders. One of our customers utilized a component of our Closed-Loop Email Analysis and Response (CLEAR) solution and realized a $345,000 reduction in full-time equivalent hires, which you can read more about in the Forrester Total Economic Impact report.
Using Your Data to Change the Conversation
A lot of metrics shared about security awareness training, like “failure rate” or “click rate,” can have a negative connotation and present users in a light that emphasizes mistakes rather than successes. Metrics like reporting rates and knowledge levels help better demonstrate how users are performing as a line of defense against today’s targeted attacks by stressing positive behaviors over negtive ones.
Additionally, there’s an opportunity to use this data to tell great stories about the ways users are improving an organization’s security posture. For instance, if a user reported a true malicious message and your incident response team was able to remove it before it exposed your organization, that story can help sell your program internally to key stakeholders, and improve your company’s culture.
To learn more about demonstrating security awareness program success, watch our Panel Webinar: Benchmarks & KPIs You Need to Know for Security Awareness Training.