
If there is one thing I’ve learned about security awareness training, it’s that effective measurement can make or break a program. Unfortunately, security awareness is one of those items that is lower in budget priority than technical controls. So, getting the metrics right and communicating them correctly to your chief information security officer (CISO) and other stakeholders will help you to:
- Get sustained buy-in
- Avoid the time and frustration of restarting your security awareness training program
Depending on how your program is composed, there may be very different concerns from upper management. If your awareness program is primarily compliance-driven, it may be a checkbox “training completed”. For organisations with awareness and behaviour metrics, it may be participation and metrics like click rate or reporting rate of simulations. And organisations with advanced programs may look even further. Let me explain.
Measuring what matters for security awareness
As Gartner’s 2021 Market Guide for Security Awareness says, “Utilise additional information security metrics beyond phishing testing “click rates” to determine program success.” We couldn’t agree with that statement more. We talk to a lot of customers that become laser-focused on the click rate of phishing simulations as the be-all and end-all of security awareness metrics. While a great starting point, it has a lot of flaws.
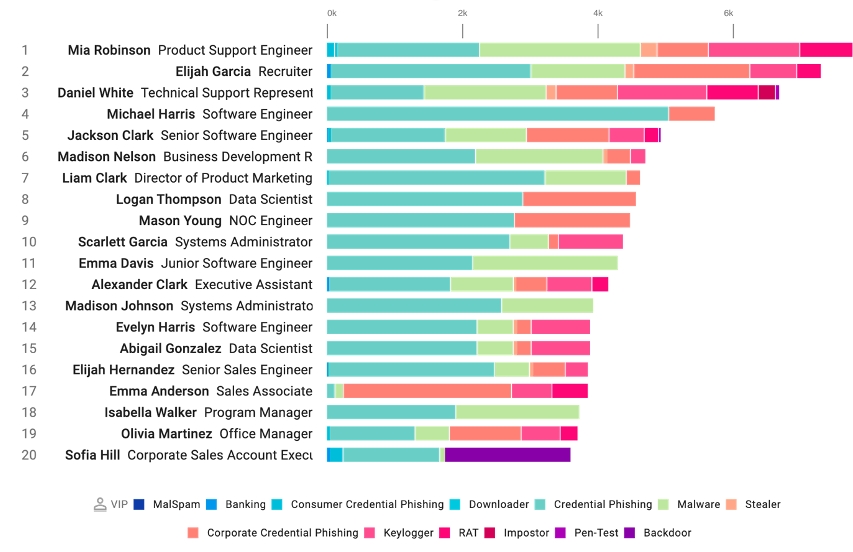
Figure 1. Very Attacked People™ are users in your organisation who receive a higher volume and more dangerous types of attacks from Proofpoint Targeted Attack Protection. Including these users in more frequent, targeted education efforts can help reduce your risk further and advance your program.
First, the click rate will be very variable based on the average failure rate of the template used, and the audience it's sent to. As programs get more advanced, you should consider more targeted templates for different audiences like Very Attacked People™ (VAPs). So, the click rate will vary, but it will only show employees are avoiding the bad—not "doing the good".
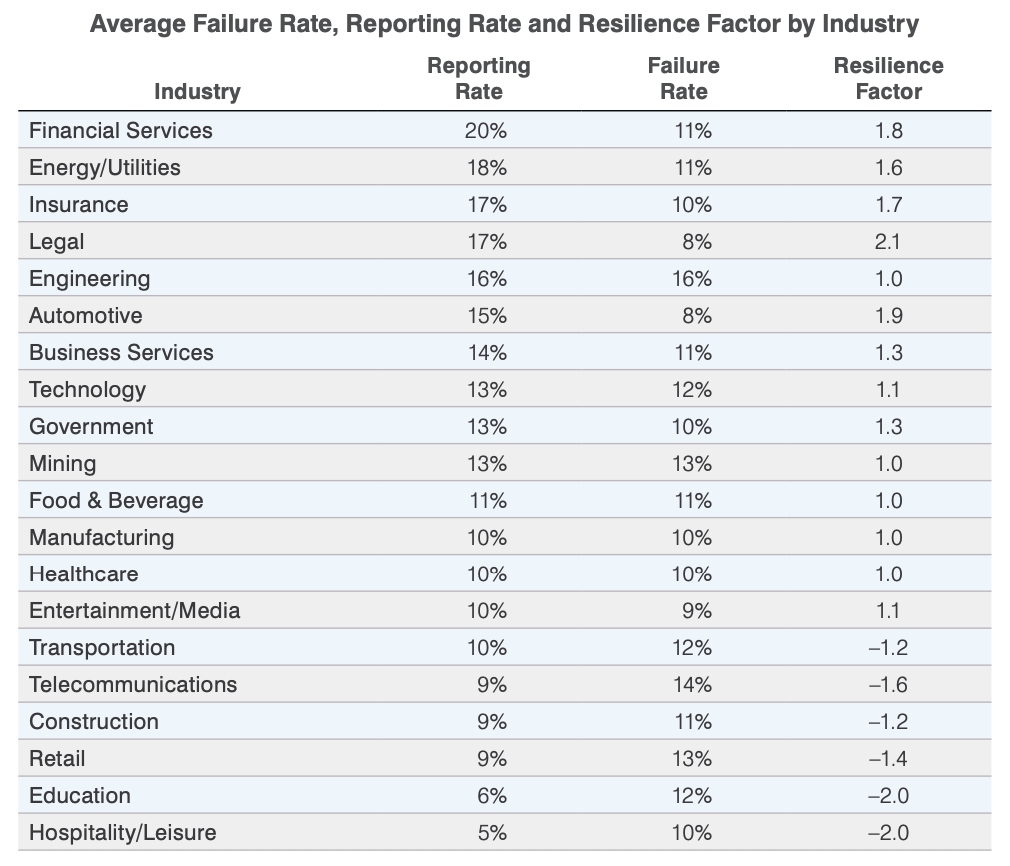
Average Failure Rate, Reporting Rate and Resilience Factor by Industry
Figure 2. Our 2021 State of the Phish shows the average “resilience factor”, or reporting rate divided by click rate. Organisations should aim to have a 14x resilience factor.
When you include a metric like reporting rate with a phishing email add-in, you can start showing users are not only avoiding an attack, but they’re also taking action—and “doing the good” to help protect the company.
As a very high-level rule, we recommend having a phishing reporting rate of 70% or higher for phishing simulations and a click rate of under 5%. This means a resilience factor of 14x for top-performing customers.
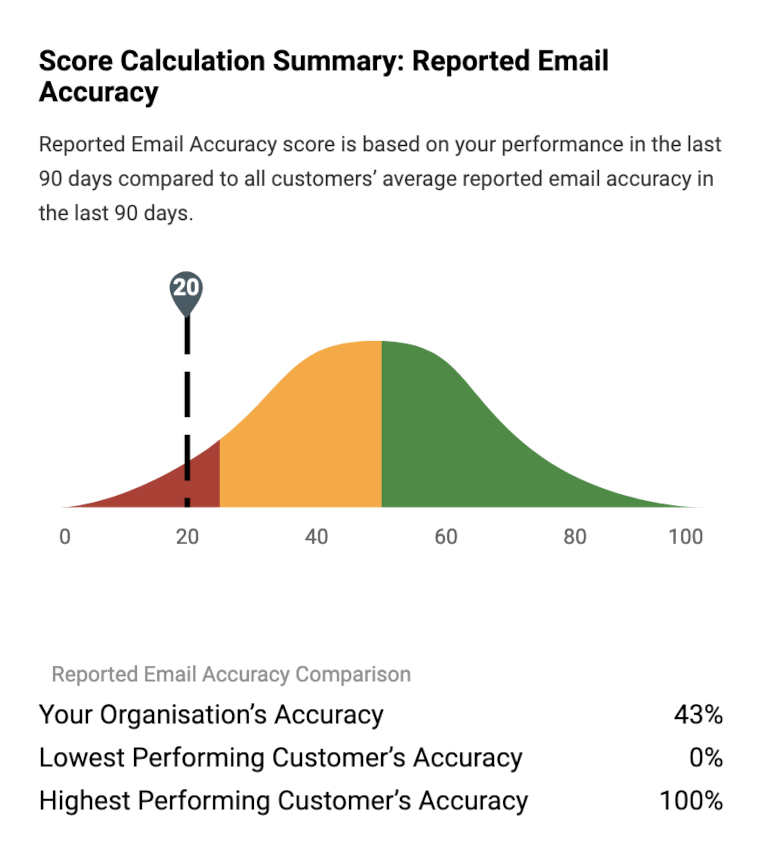
Figure 3. Our new CISO Dashboard will show you different program areas and what percentile you are in compared with other customers. This provides context and allows you to focus on areas for improvement.
Going a level deeper, it’s essential, and enlightening, to understand the real security impacts of your security awareness program. For instance, if users are reporting messages, are they reporting safe messages or malicious ones?
We use the Proofpoint threat detection stack to score user-reported emails. We can show you how much malicious email they’re reporting, and how that compares with other customers.
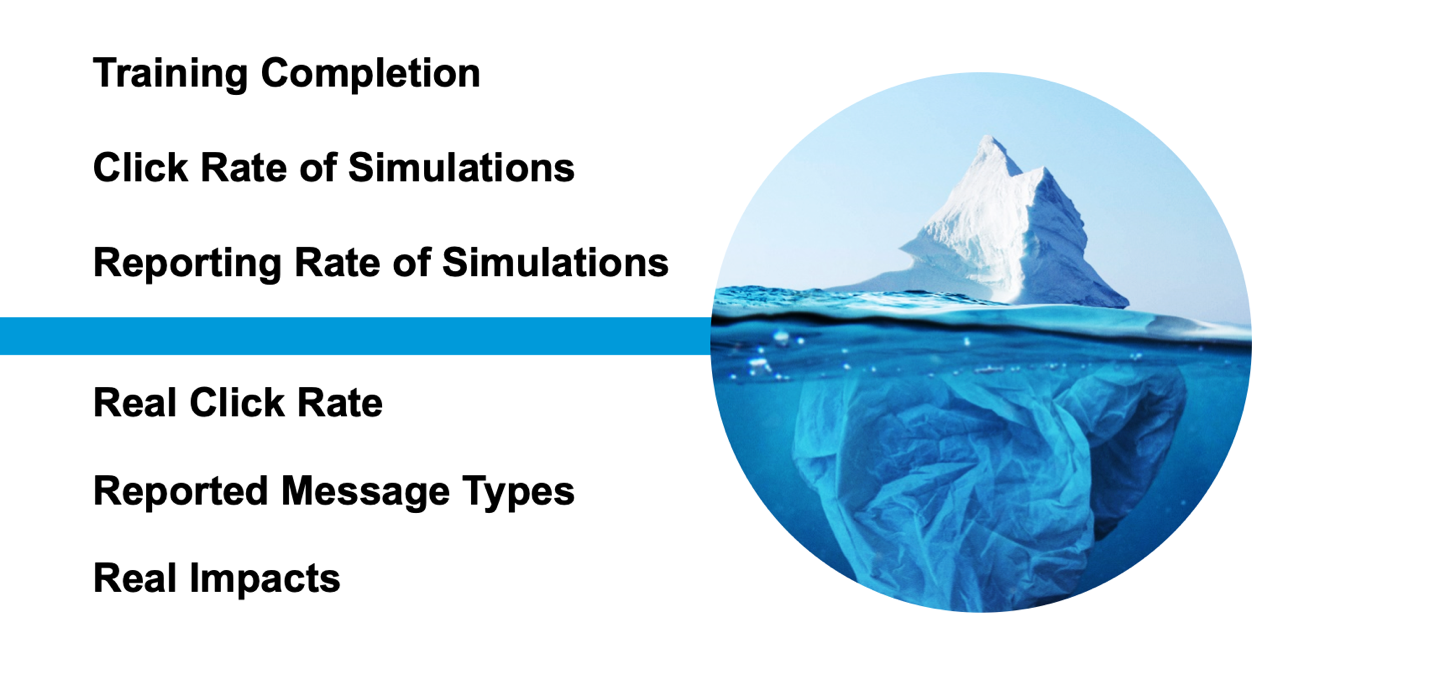
Figure 4. Security awareness impacts go beyond compliance and simulation metrics, and can improve overall security through reducing the real click rate, reporting malicious messages and reducing human-driven security incidents.
Additionally, if you’re able to gather other human-centric security impacts, like:
- Successful phishing incidents
- Click rate of known malicious content
- Credential compromises
- Insider incidents
- Machine remediations due to malware and ransomware
…then, you can prove those key metrics have decreased and been influenced by your awareness program. And then, you’ll improve future investment and show how your program is changing behaviour and driving culture.
Understanding user vulnerability
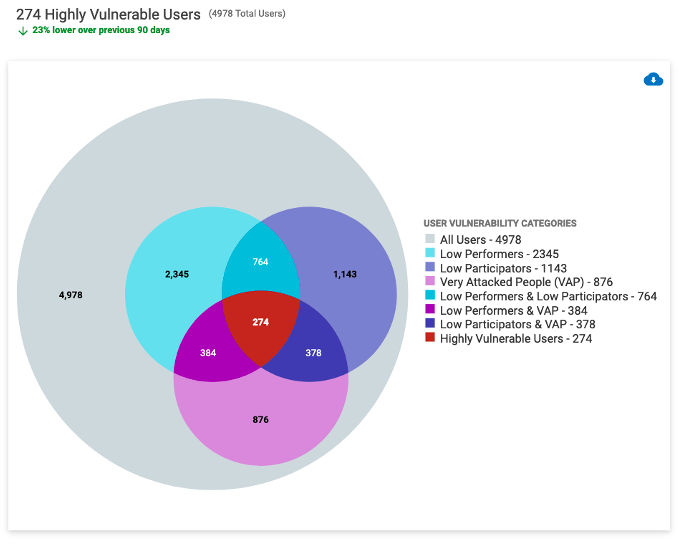
Figure 5. Our User Vulnerability section of the CISO Dashboard will show you low performers and participators. If users are VAPs in Proofpoint Targeted Attack Protection, that data will be integrated as well for a better view of vulnerability.
Sometimes, it can be challenging to get buy-in to expand the awareness program. Stakeholders are worried that users are spending too much time in training, or they’ll become tired of the security awareness exercises.
One of the strategies we’ve seen customers use is to focus on vulnerable users at a more frequent cadence. That way, stakeholders know there is a good reason for the additional education touchpoints with these users, and not all users require the same education. It’s a strategic way to advance your program that stakeholders can agree to.
Communicating effectively to your CISO and key stakeholders
At Wisdom 2021, our annual security awareness event, many at the conference spoke to the overuse of fear, uncertainty, and doubt (FUD) being overused. When communicating to security leaders, FUD can only get you so far.
So, how do you communicate security awareness performance to your CISO and other stakeholders? There are two important attributes: quantitative and qualitative components.
When talking about quantitative scores, understanding your overall performance and how you compare against others matters for context. When possible, focus on positive metrics instead of just the negative “click rate”. For example:
- Users reported more phishing simulations
- Security awareness knowledge improved
- Users became better at reporting real malicious message
- More users participated in our security awareness activities
Our new CISO Dashboard allows you to do this easily, with performance and participation scores that show you which percentile range you rank for each area, and how that score has changed overall. The overall score makes it simple to show quickly where you’re at in a glance, and the stoplight-style icons can give you areas to focus on for program improvement.
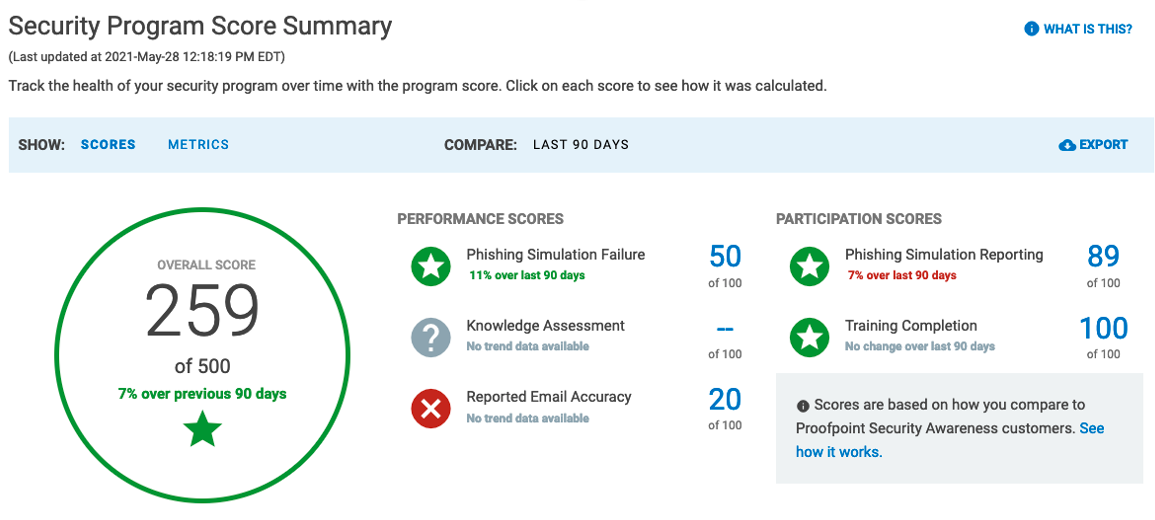
Figure 6. The Security Program Score Summary helps you communicate program performance quickly to your CISO.
While quantitative is important, it’s just as important to communicate the qualitative stories from users. For instance:
- Did a user stop a real phishing attack that was sophisticated?
- Did you get positive user sentiment from your awareness program? (Consider setting up an email alias or sending out a quick feedback survey)
- Did an executive staff member or well-known person at your organisation share something about security awareness with their staff?
These stories combined with quantitative data help build a narrative that security awareness is more than a required compliance activity, users are changing their behaviour, and the culture is actively shifting as users better understand the risks and help protect the company.
Want to learn more about building a successful security awareness program and measuring success? Watch our on-demand webinar or read our security awareness eBook to learn best practices for building and sustaining a security culture in your organisation.