
Security leaders need to show that their security awareness and training (SAT) programs reduce risk. Most organizations struggle to find the right metrics to prove it. The easiest numbers to collect, such as training completions and click rates, say little about how people handle real-world threats.
Those metrics leave SAT teams reporting activity instead of improvement. Our data points to a better signal.
Badges recognize your people and give you a clearer picture of risk
Badges are digital recognition for people who take the right security action, such as reporting a suspicious or malicious email. They are awarded to learners and displayed on the learner dashboard, visible to colleagues across the organization.
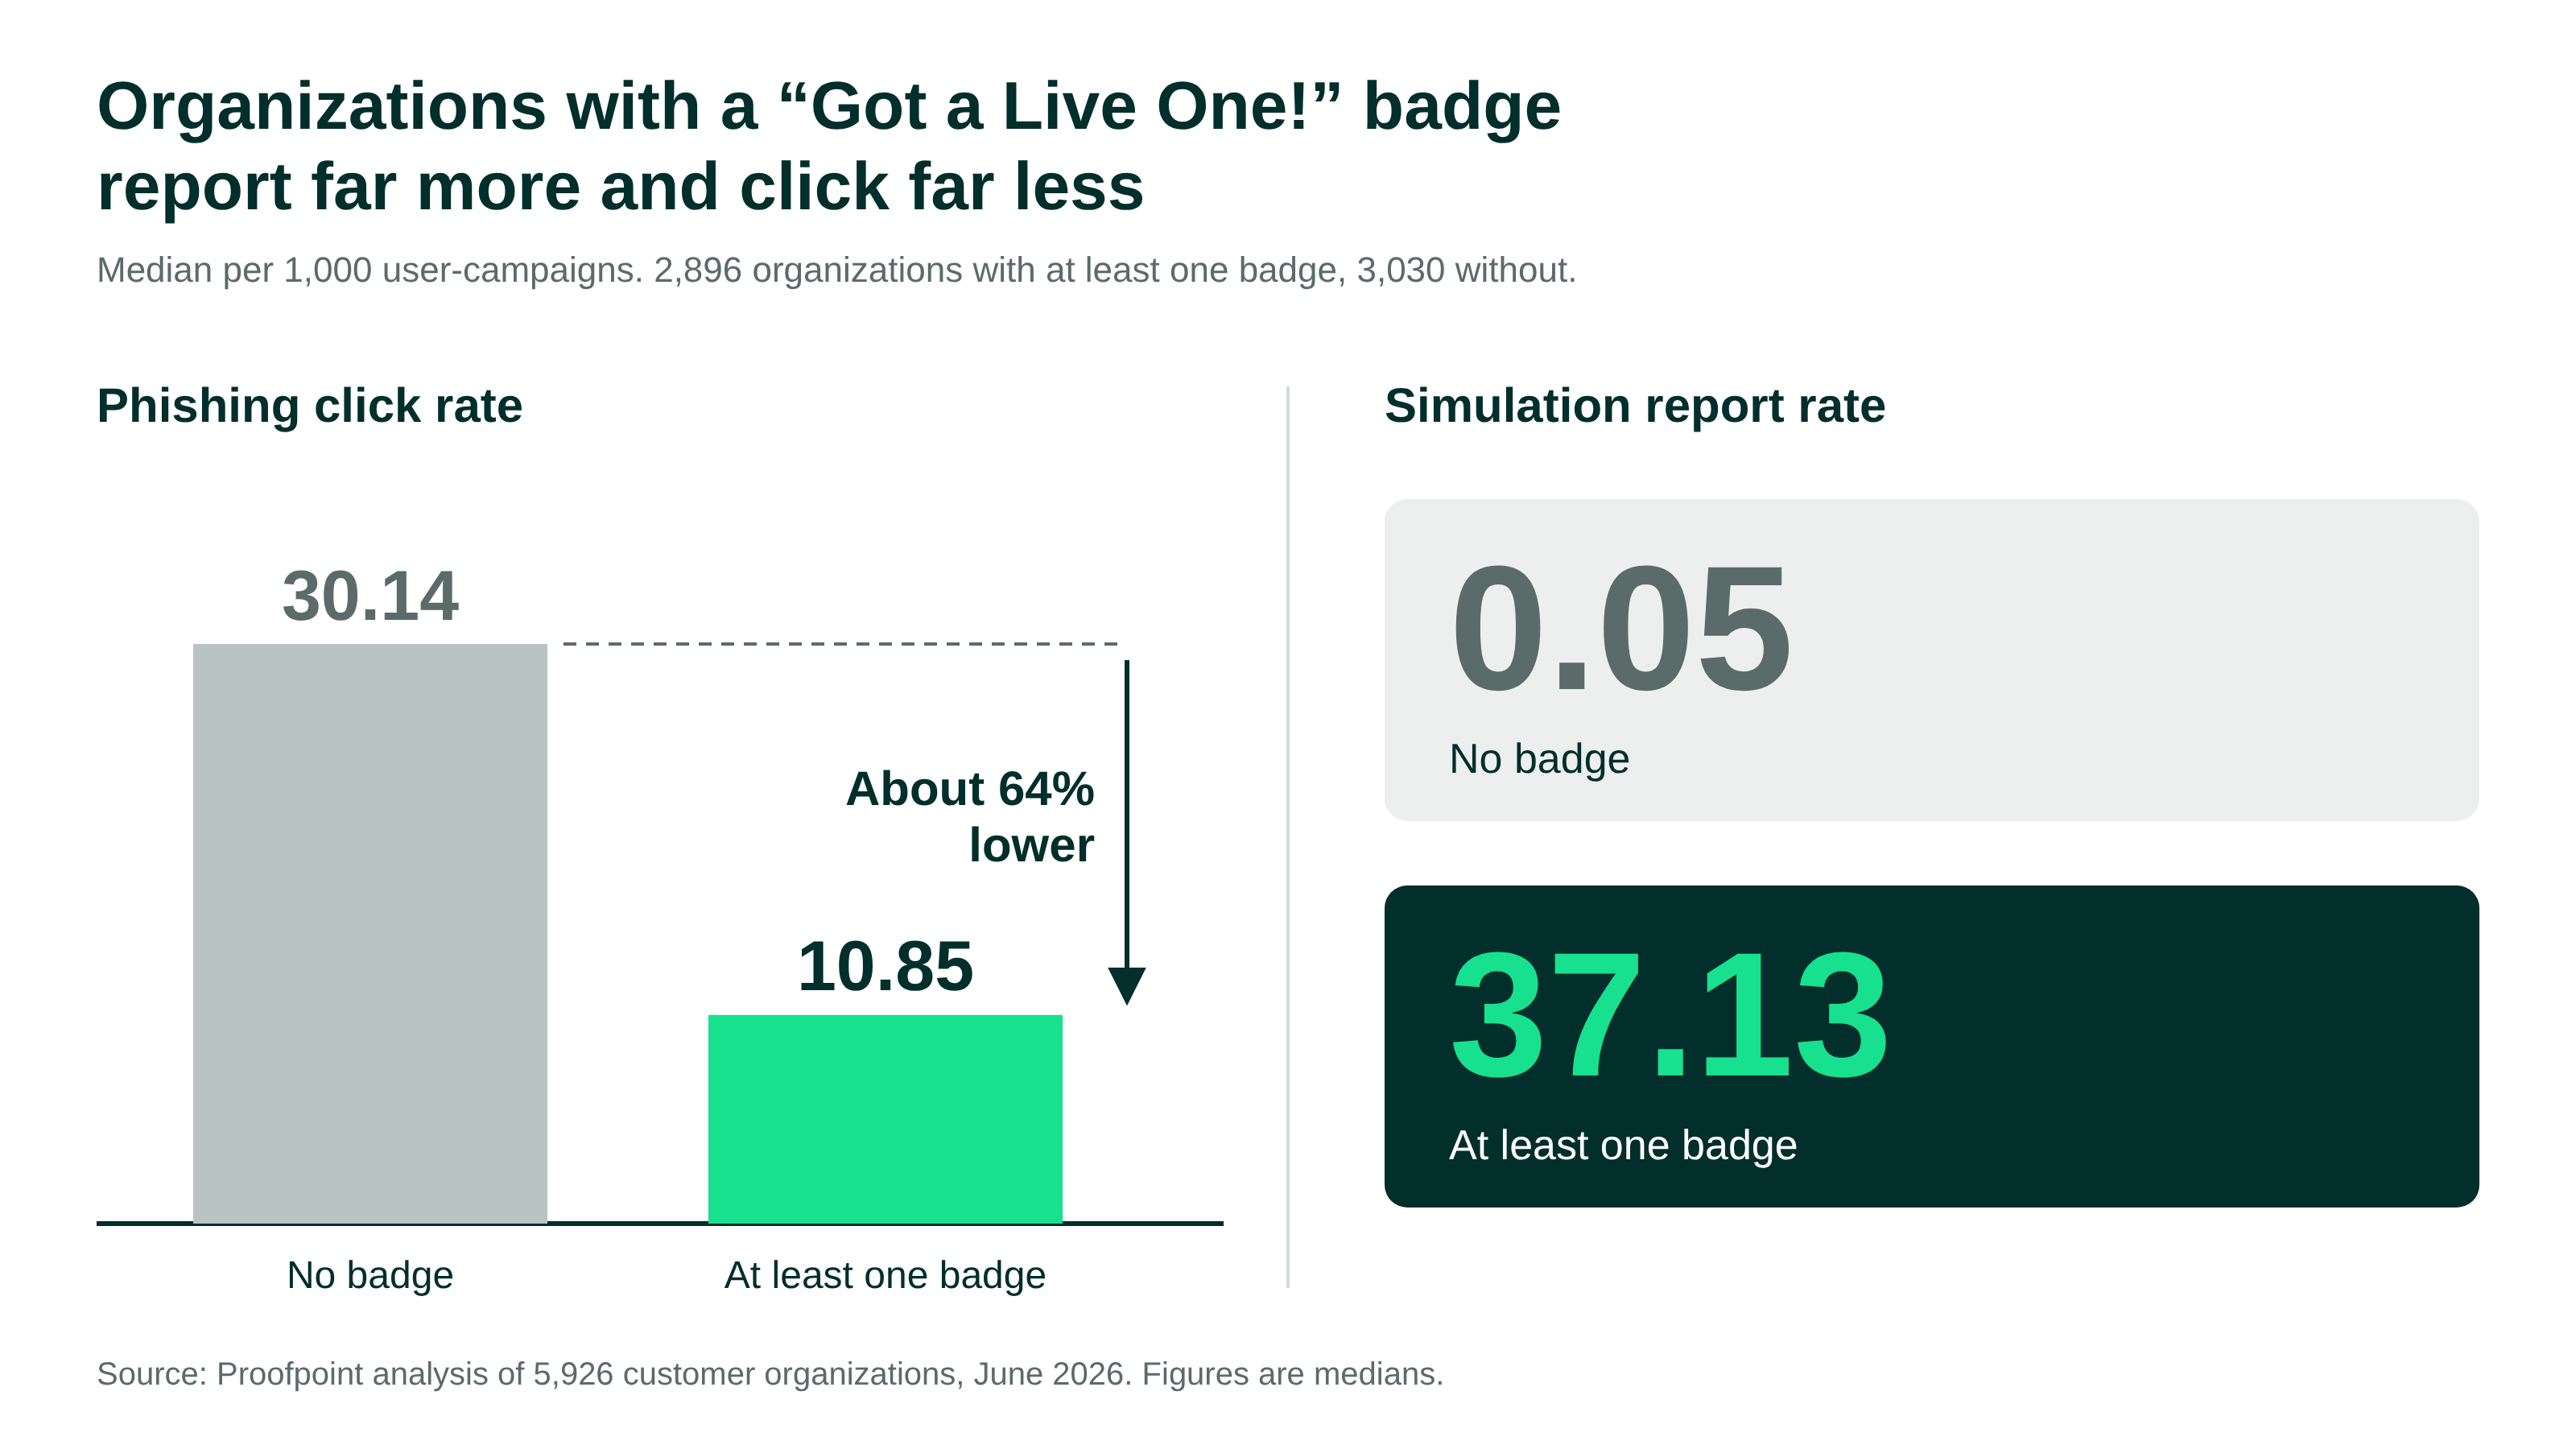
The data shows what badges reveal. Organizations with at least one “Got a Live One!” badge, earned by reporting a real phishing email, show a much higher simulation-report rate. Their median click rate is about 64% lower. Even one badge is associated with a higher-reporting, lower-click profile.
Badges also help build security culture. They show which people are successfully reporting threats across every team and location, and they reward those people with recognition others can see.
The metric challenge
The job of proving posture is improving usually lands with the SAT team. The typical metrics are completed training assessments, phishing simulations launched, learners engaged, and campaign completions. These come from the traditional compliance approach to awareness training, and they measure activity. A completed assignment, successful or not, shows training happened. It does not show your organization can handle real-world threats.
Click rate has a blind spot too. A person who does not click may have spotted the phish or may have deleted it without a second look. A report is the clearest signal that the person recognized the phish.
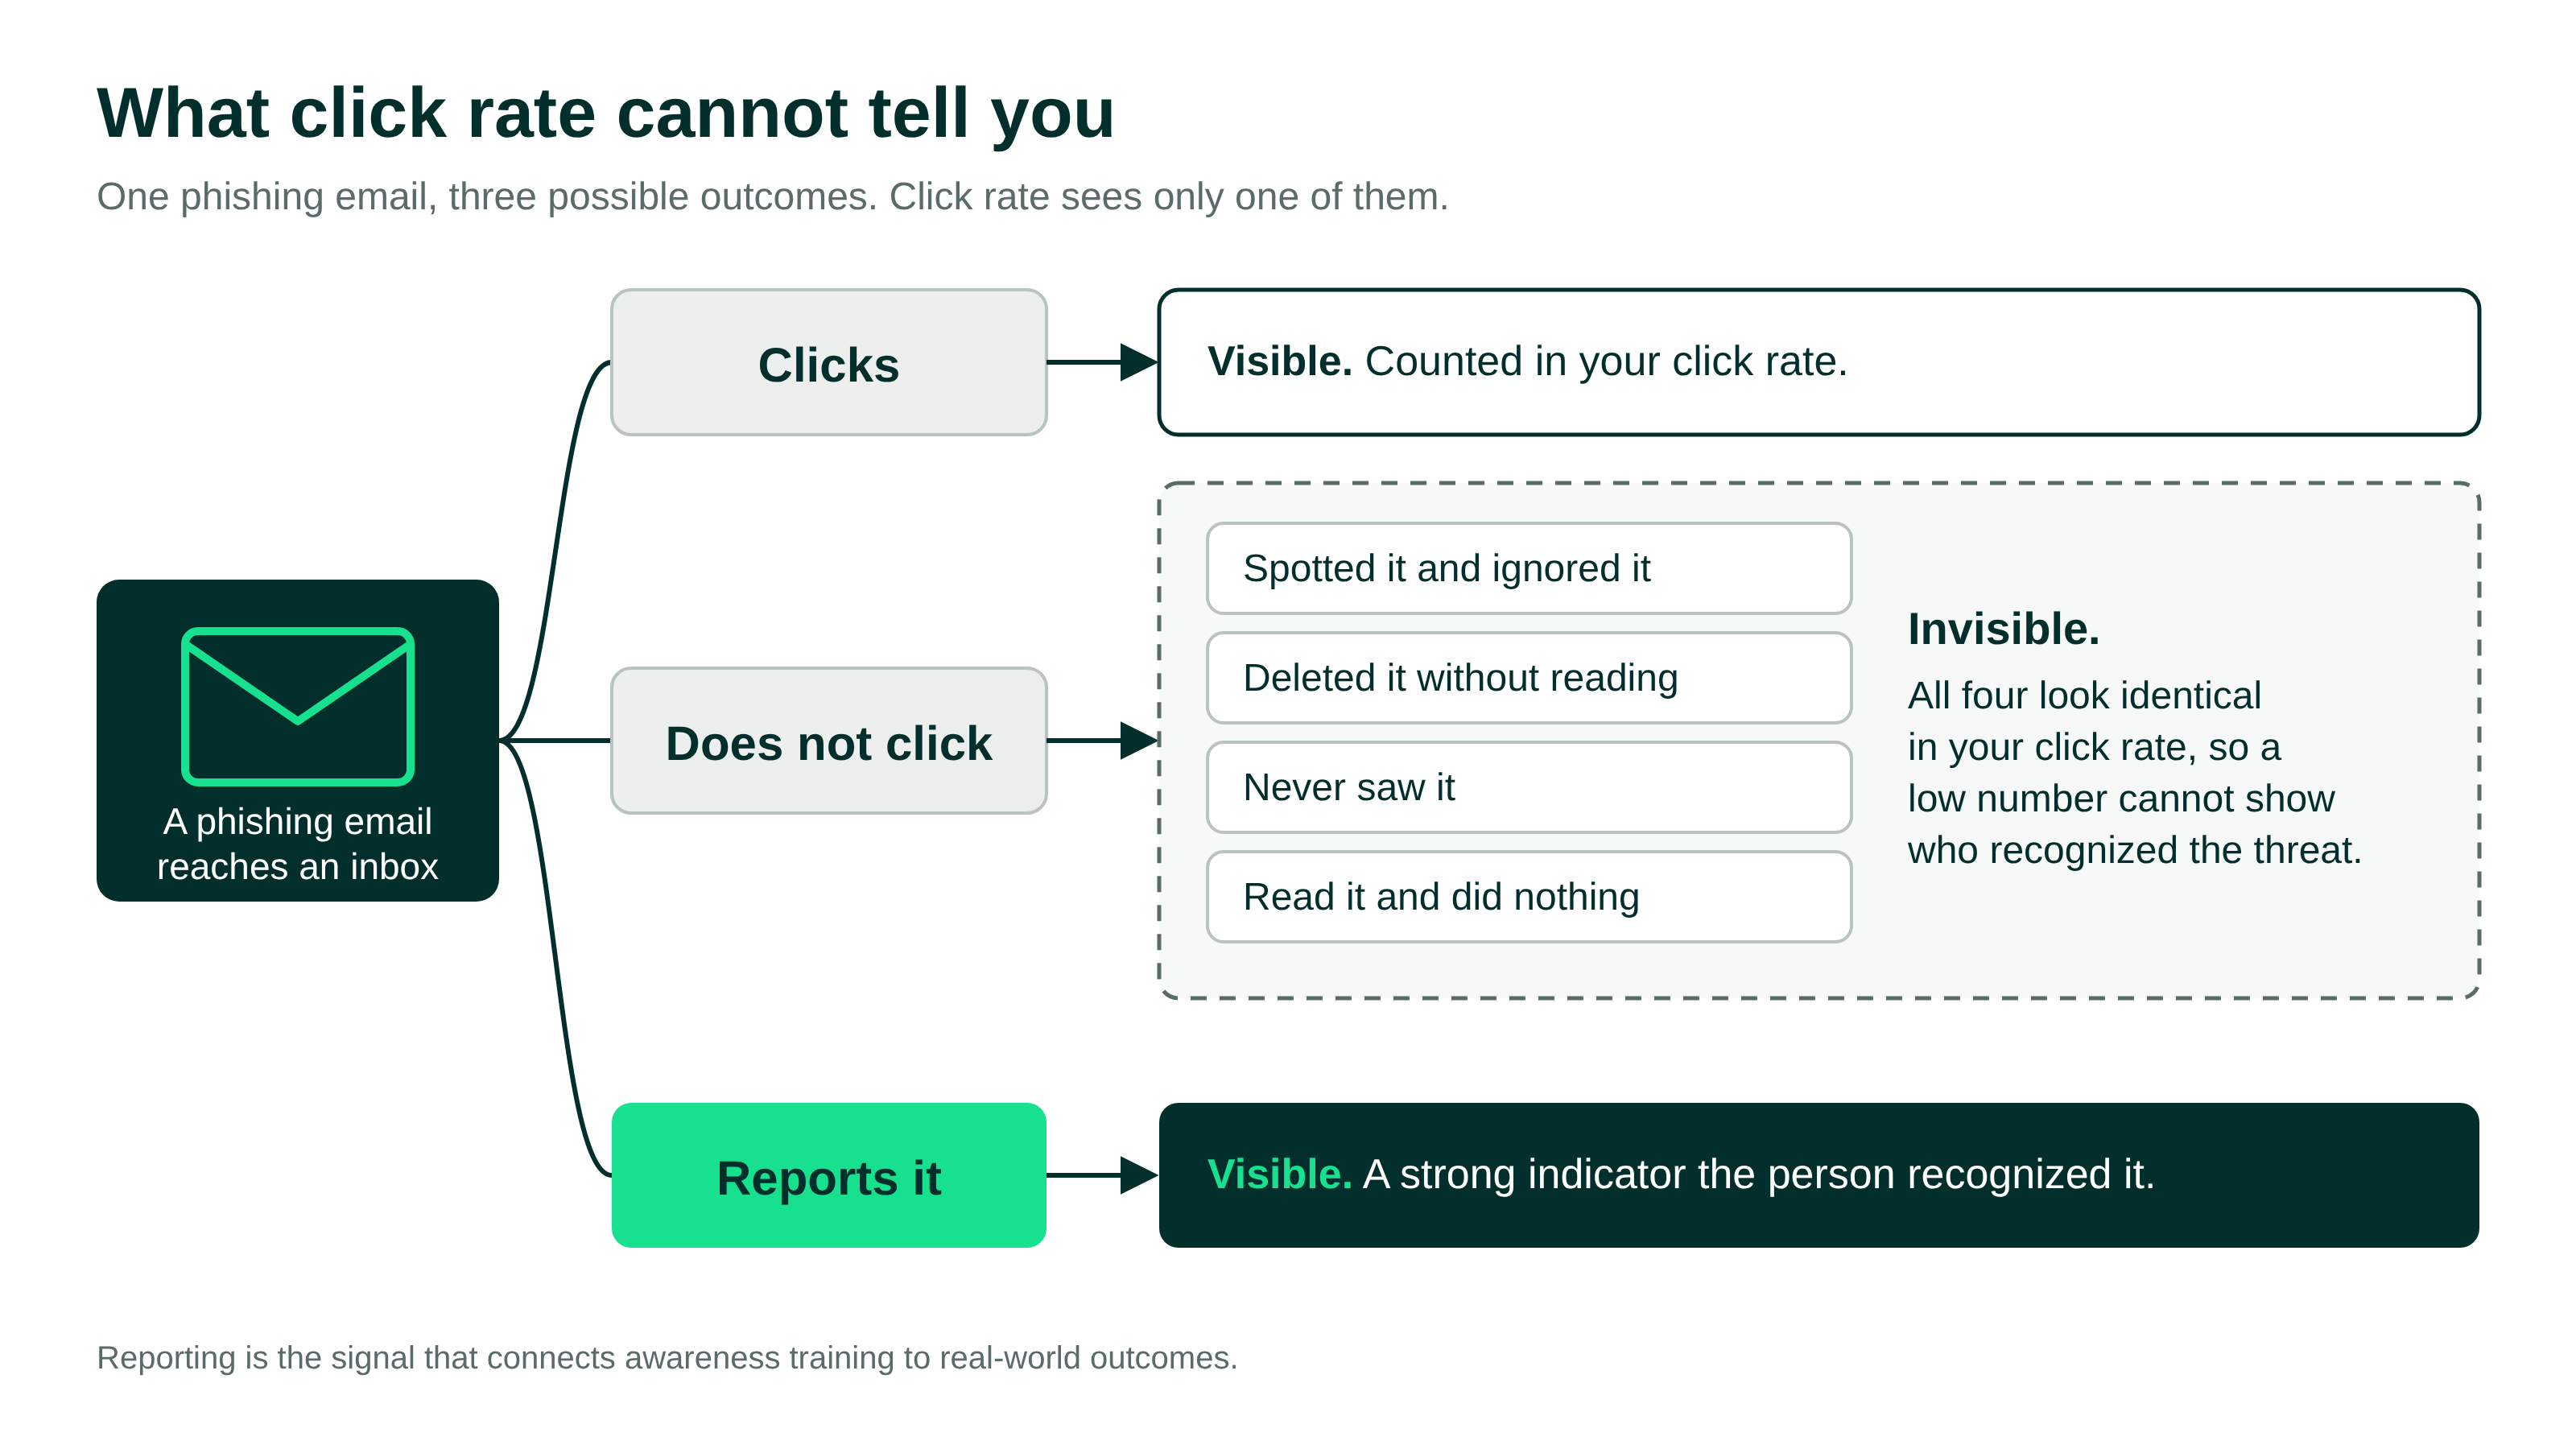
The problem grows when the SAT team and the SOC work separately. SOC analysts see which reported messages were real threats and which people responded correctly. SAT admins often do not. Your posture may be improving, but the visibility gap can keep both the SAT team and security leadership from seeing the evidence.
Reporting behavior is the signal that connects training to real-world outcomes. Badges make it visible.
Recognition reinforces the behavior you want
Lasting behavior change comes from repetition and recognition. Your people want to help protect the business, and they appreciate recognition for a job well done. Badges deliver both, acknowledging the person in near real time when their behavior shows the training is working.
Reporting takes two things: the knowledge that consistent awareness training builds, and a tool that makes reporting easy. With both in place, people report what is suspicious instead of ignoring it or guessing, and the organization keeps getting better at detecting real threats.
How badges move security culture in one direction
Recognition motivates by rewarding the right action, and the right action reduces risk. Different badges recognize different behaviors. In Proofpoint® ZenGuide, people earn badges for reporting:
- Threat Spotter: a first suspicious email, real or simulated
- Got a Live One!: a real phishing email
- Tough to Trick: three phishing simulations in a row
- Unbreakable: five phishing simulations in a row
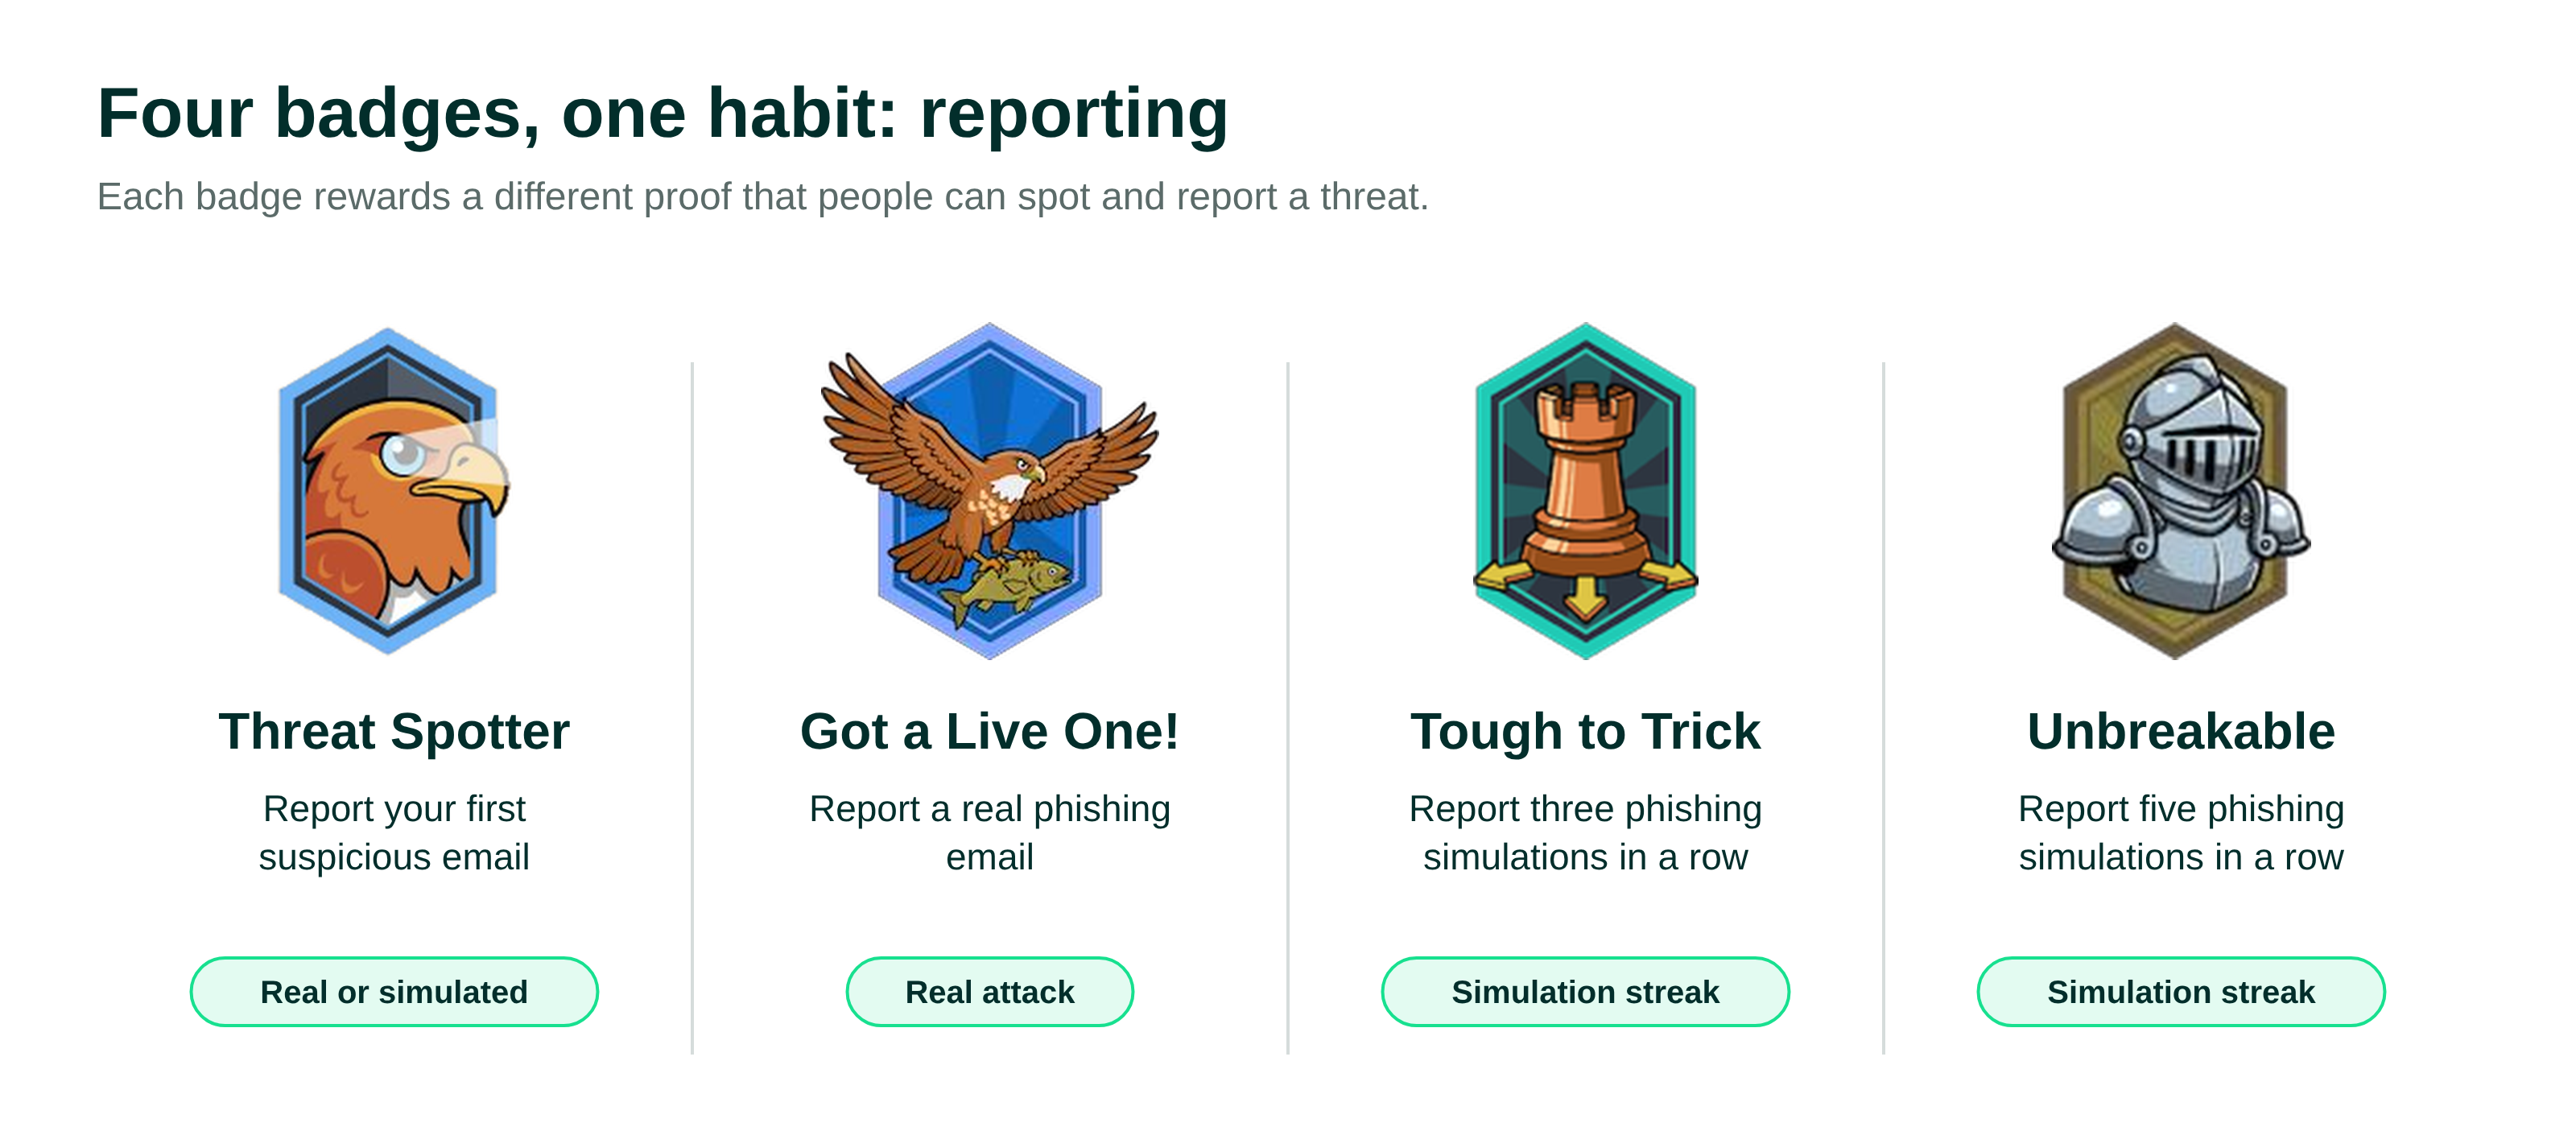
Each badge rewards a different part of the same habit. A first report shows willingness. A streak shows consistency. A real catch shows the skill works against a live attack. Varied criteria give people something to earn at every stage, which keeps them engaged while each behavior strengthens your posture.
The pattern holds across badge types. Organizations that earn more “Got a Live One!” badges per person report phishing more and click less, with a stronger report-to-click ratio, meaning more reports for every click. The streak badges, “Tough to Trick” and “Unbreakable,” follow the same pattern when measured separately: more badges, more reporting, fewer clicks.
Three of these badges pointing the same way is what a strong reporting culture looks like.
What the data means for your program
A first “Got a Live One!” badge signals maturity. Behind the 64% is a wide difference. The median simulation report rate was 0.05 per 1,000 user-campaigns without a “Got a Live One!” badge and 37.13 with one. The median click rate was 30.14 without and 10.85 with, also per 1,000 user-campaigns. Treat a first “Got a Live One!” badge as a milestone worth tracking and presenting to leadership.
Balance beats any single metric. No one number defines a strong program. Among the top-performing organizations in our data, the common pattern is a combination of three things:
- Broad adoption: 80% or more of end users with a Security Score greater than 1 (a score that builds as people complete training or report phishing)
- Training depth: a median of roughly 15 to 21 training points earned per learner at 80% or higher adoption, compared with about 5 below 40% adoption
- Strong reporting culture: people reporting real threats and earning badges for it, as the report-rate gap above shows
High adoption alone is not enough. If every person receives the same content, much of it misses the mark. A finance analyst and an HR coordinator face different threats, so training should match each person’s role and access. Even well-targeted training gives leadership little evidence of improvement if people do not report. The three together are what behavior change looks like at scale.
Build the case with metrics leadership expects
Leadership asks the security team one question: is risk going down? Report-to-click ratio and badge milestones give you measurable evidence of behavior change. When more people catch real threats and fewer people click, you can show improving human risk, not just completed training.
Whether you run the program or answer for it, start by checking where your program stands against those three measures: broad adoption, training depth, and a strong reporting culture. Then see how Proofpoint ZenGuide helps you reduce human risk and measure the change.
- Proofpoint analysis, July 2026, of 5,926 customer organizations with at least one end user, one scored user, and one phishing campaign, using data from 01/01/2026 to 06/30/2026. “At least one badge” means at least one user in the organization earned the “Got a Live One!” badge. Figures are medians per 1,000 user-campaigns, where user-campaigns are estimated as end users x phishing campaigns.
- Same source and methodology as note 1.
- Proofpoint analysis of 7,440 customer organizations, using data from 01/01/2026 to 06/30/2026. Adoption is the share of end users with a Security Score greater than 1. Figures are median training points per scored learner within each 10-point adoption band. The top-performer band comes from a screen of 8,056 organizations with at least 250 end users, 100 scored users, and 8 phishing campaigns. These are descriptive findings, not causal thresholds.