 us:
English: Americas
us:
English: Americas


Proofpoint Announces Fourth Quarter and Full Year 2017 Financial Results

Fourth Quarter Highlights
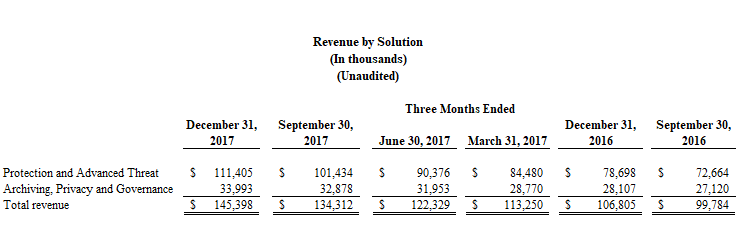
- Total revenue of $145.4 million, up 36% year-over-year
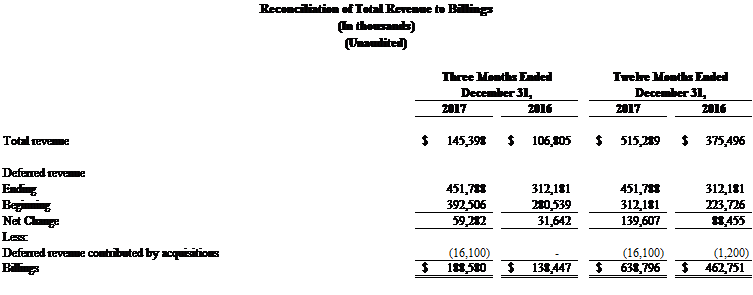
- Billings of $188.6 million, up 36% year-over-year
- GAAP EPS of $(0.24) per share, Non-GAAP EPS of $0.29 per share
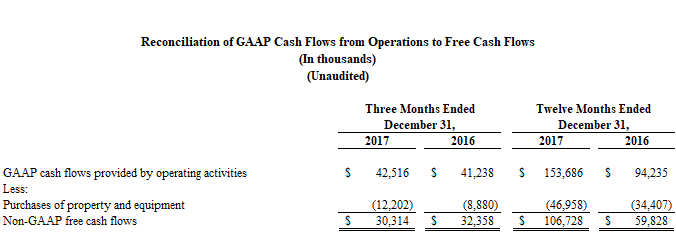
- Generated operating cash flow of $42.5 million and free cash flow of $30.3 million
- Increasing FY18 billings, revenue and profitability guidance
SUNNYVALE, Calif., – February 6, 2018 – Proofpoint, Inc. (NASDAQ: PFPT), a leading next-generation security and compliance company, today announced financial results for the fourth quarter and full year ended December 31, 2017.
“We were very pleased with our fourth quarter results, which marked a strong end to the year. During 2017, we successfully executed our growth strategy and extended our leadership position, as evidenced by the ongoing robust add-on and renewal activity and increased penetration of the Fortune 1000,” stated Gary Steele, chief executive officer of Proofpoint. “We entered 2018 with strong momentum and are well-positioned to benefit from enterprise cloud migration as well as our unique visibility and insight into the threat landscape.”
Fourth Quarter 2017 Financial Highlights
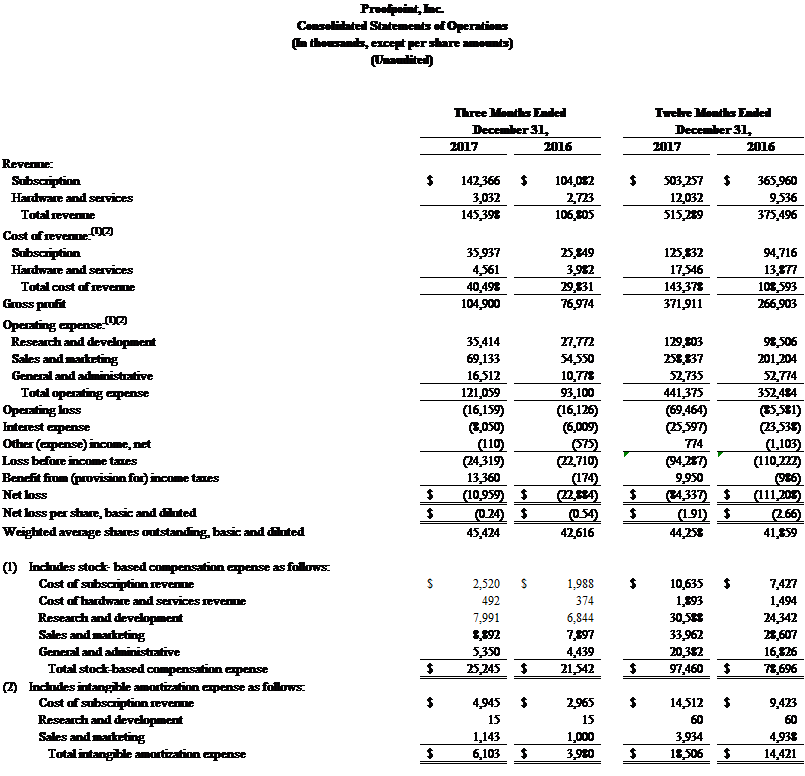
- Revenue: Total revenue for the fourth quarter of 2017 was $145.4 million, an increase of 36%, compared to $106.8 million for the fourth quarter of 2016. This included approximately $3.0 million in revenue related to the Cloudmark and Weblife acquisitions, and excluding this impact, annual growth represented 33%.
- Billings: Total billings were $188.6 million for the fourth quarter of 2017, which excluded the $16.1 million in deferred revenue related to the Cloudmark and Weblife acquisitions, and represented an increase of 36%, compared to $138.4 million for the fourth quarter of 2016.
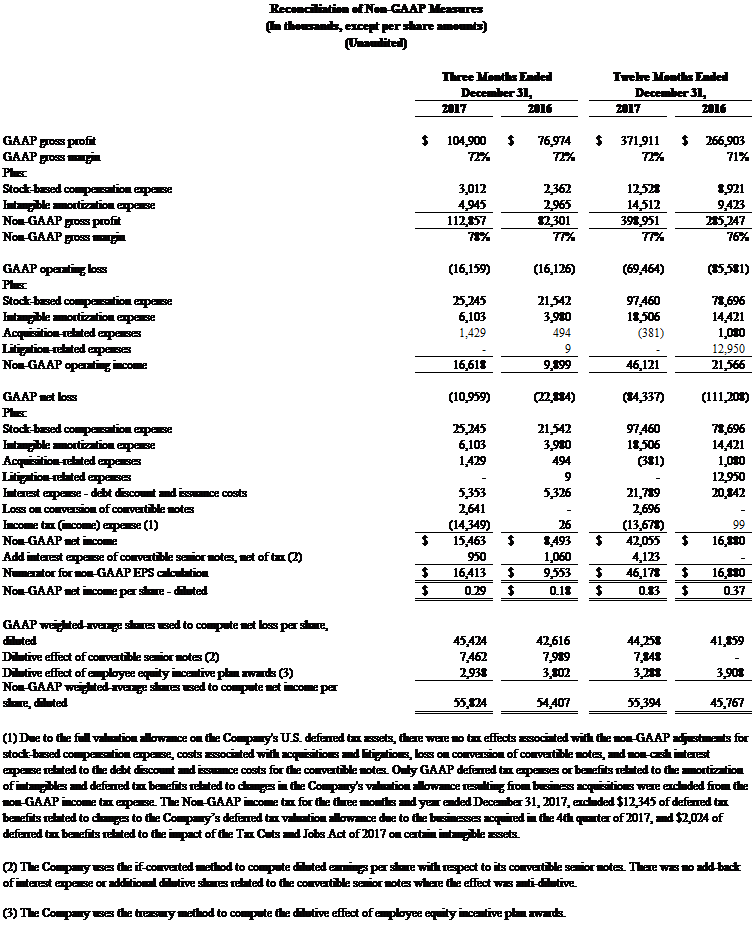
- Gross Profit: GAAP gross profit for the fourth quarter of 2017 was $104.9 million compared to $77.0 million for the fourth quarter of 2016. Non-GAAP gross profit for the fourth quarter of 2017 was $112.9 million compared to $82.3 million for the fourth quarter of 2016. GAAP gross margin for the fourth quarter of 2017 was 72%, consistent with the fourth quarter of 2016. Non-GAAP gross margin was 78% for the fourth quarter of 2017 compared to 77% for the fourth quarter of 2016.
- Operating Income (Loss): GAAP operating loss for the fourth quarter of 2017 was $(16.2) million compared to a loss of $(16.1) million for the fourth quarter of 2016. Non-GAAP operating income for the fourth quarter of 2017 was $16.6 million compared to $9.9 million for the fourth quarter of 2016.
- Net Income (Loss): GAAP net loss for the fourth quarter of 2017 was $(11.0) million, or $(0.24) per share, based on 45.4 million weighted average shares outstanding. This compares to a GAAP net loss of $(22.9) million, or $(0.54) per share, based on 42.6 million weighted average shares outstanding for the fourth quarter of 2016. GAAP net loss for the fourth quarter of 2017 included a tax benefit of $13.4 million.
Non-GAAP net income for the fourth quarter of 2017 was $15.5 million, or $0.29 per share, based on 55.8 million weighted average diluted shares outstanding. This compares to a non-GAAP net income of $8.5 million, or $0.18 per share, based on 54.4 million weighted average diluted shares outstanding for the fourth quarter of 2016. Non-GAAP earnings per share for the fourth quarter of 2017 included the shares associated with the company’s convertible notes, and cash interest expense (net of tax) of $1.0 million was added back to net income as the “If-Converted” threshold during the period was achieved.
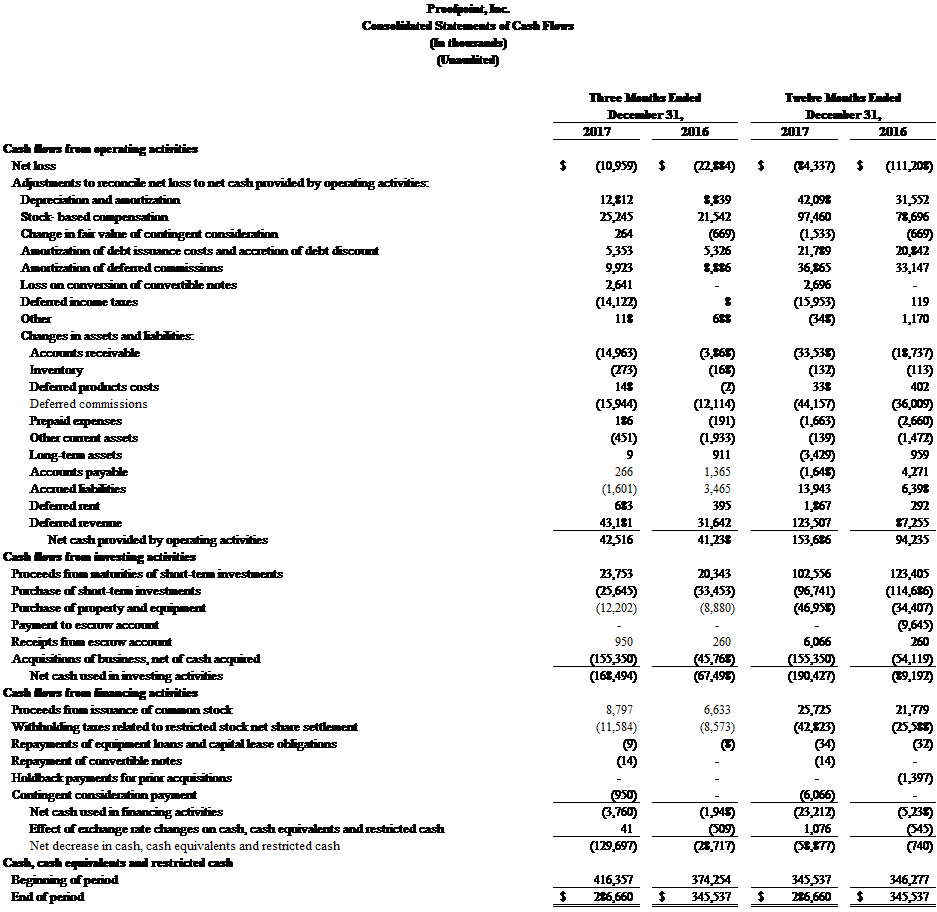
- Cash and Cash Flow: As of December 31, 2017, Proofpoint had cash, cash equivalents, and short term investments of $331.6 million. The company generated $42.5 million in net cash from operations for the fourth quarter of 2017 compared to $41.2 million during the fourth quarter of 2016. The company’s free cash flow for the quarter was $30.3 million compared to $32.4 million for the fourth quarter of 2016. Free cash flow during the fourth quarter of 2017 included a one-time tax payment of approximately $3.6 million related to the decision to transfer the intellectual property related to the FireLayers acquisition from Israel to the United States.
“We were very pleased with our fourth quarter results, which capped off another strong year for Proofpoint,” stated Paul Auvil, chief financial officer of Proofpoint. “During 2017, we delivered billings growth of 38%, revenue growth of 37%, and increased our free cash flow margin to approximately 21%, all of which represented significant progress toward our 2020 targets.”
Full Year 2017 Financial Highlights
- Revenue: Total revenue for the full year of 2017 was $515.3 million, an increase of 37% compared to $375.5 million in 2016.
- Billings: Total billings for the full year of 2017 were $638.8 million, an increase of 38% compared to $462.8 million in 2016.
- Gross Profit: GAAP gross profit for the full year of 2017 was $371.9 million compared to $266.9 million for 2016. Non-GAAP gross profit for the full year of 2017 was $399.0 million compared to $285.2 million for 2016. GAAP gross margin for the full year of 2017 was 72% compared to 71% for 2016. Non-GAAP gross margin was 77% for the full year of 2017 compared to 76% for 2016.
- Operating Income (Loss): GAAP operating loss for the full year of 2017 was $(69.5) million compared to a loss of $(85.6) million for 2016. Non-GAAP operating income for the full year of 2017 was $46.1 million compared to $21.6 million for 2016.
- Net Income (Loss): GAAP net loss for the full year of 2017 was $(84.3) million, or $(1.91) per share, based on 44.3 million weighted average shares outstanding. This compares to a GAAP net loss of $(111.2) million, or $(2.66) per share, based on 41.9 million weighted average shares outstanding for 2016.
Non-GAAP net income for the full year of 2017 was $42.1 million, or $0.83 per share, based on 55.4 million weighted average diluted shares outstanding. This compares to a non-GAAP net income of $16.9 million, or $0.37 per share, based on 45.8 million weighted average diluted shares outstanding for 2016. Non-GAAP earnings per share for the full year of 2017 included the shares associated with the company’s convertible notes, and cash interest expense (net of tax) of $4.1 million was added back to net income as the “If-Converted” threshold during the period was achieved.
- Cash Flow: The company generated $153.7 million in net cash from operations for the full year of 2017 compared to $94.2 million during 2016. The company generated free cash flow of $106.7 million for the full year of 2017 compared to $59.8 million during 2016.
A reconciliation of GAAP to non-GAAP financial measures has been provided in the financial tables included in this press release. An explanation of these measures and how they are calculated are also included below under the heading “Non-GAAP Financial Measures.”
Fourth Quarter and Recent Business Highlights:
- Closed the acquisition of Cloudmark, a leader in messaging security and threat intelligence for Internet Service Providers and mobile carriers worldwide, enabling Proofpoint to better protect customers from today’s rapidly evolving threats.
- Closed the acquisition of Weblife, a leader in browser isolation solutions, which will allow Proofpoint customers to extend their protection to web-based personal email accounts, while preserving the privacy of their users.
- Positioned in the Leaders quadrant of Gartner’s 2017 Magic Quadrant for Enterprise Information Archiving for the sixth consecutive year.
- Redeemed all outstanding 1.25% Senior Convertible Notes due 2018, which resulted in the issuance of 5.1 million shares of common stock pursuant to conversion elections delivered by noteholders prior to the redemption date.
Financial Outlook
As of February 6, 2018, Proofpoint is providing guidance for its first quarter and increasing full year 2018 guidance as follows:
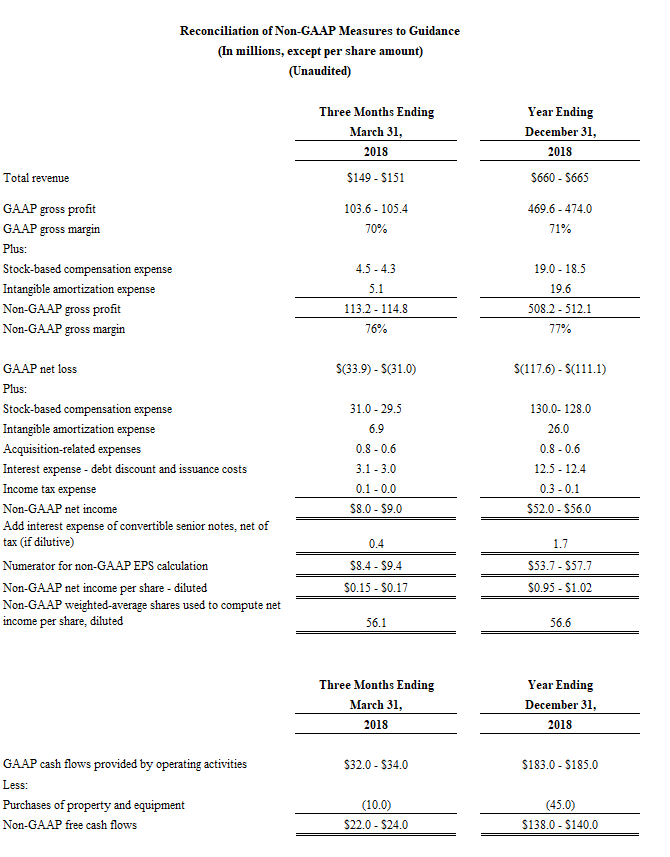
- First Quarter 2018 Guidance: Total revenue is expected to be in the range of $149.0 million to $151.0 million. Billings are expected to be in the range of $180.0 million to $182.0 million. GAAP gross margin is expected to be 70%. Non-GAAP gross margin is expected to be 76%. GAAP net loss is expected to be in the range of $(33.9) million to $(31.0) million, or $(0.67) to $(0.61) per share, based on approximately 50.5 million weighted average diluted shares outstanding. Non-GAAP net income is expected to be in the range of $8.0 to $9.0 million, or $0.15 to $0.17 per share, using 56.1 million weighted average diluted shares outstanding, and adding back the $0.4 million in cash interest expense as prescribed under the “If-Converted” method. Free cash flow during the quarter is expected to be in the range of $22.0 million to $24.0 million, which assumes capital expenditures of approximately $10.0 million.
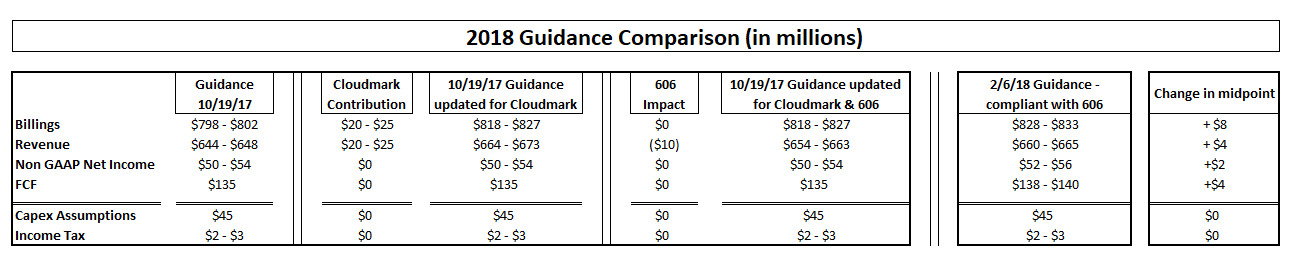
- Full Year 2018 Guidance: Total revenue is expected to be in the range of $660.0 million to $665.0 million. Billings are expected to be in the range of $828.0 million to $833.0 million. GAAP gross margin is expected to be 71%. Non-GAAP gross margin is expected to be 77%. GAAP net loss is expected to be in the range of $(117.6) million to $(111.1) million, or $(2.31) to $(2.18) per share, based on approximately 50.9 million weighted average diluted shares outstanding. Non-GAAP net income is expected to be in the range of $52.0 million to $56.0 million, or $0.95 to $1.02 per share, using 56.6 million weighted average diluted shares outstanding, and adding back the $1.7 million in cash interest expense as prescribed under the “If-Converted” method. Free cash flow for the full year is expected to be in the range of $138.0 million to $140.0 million, which assumes capital expenditures of approximately $45.0 million for the full year.
Given the company’s adoption of ASC 606 effective January 1, 2018, the following financial table summarizes the company’s previous full year 2018 guidance to show the impact from this new accounting standard compared to the historical standard, and also the expected 2018 contribution from the Cloudmark acquisition.
Quarterly Conference Call
Proofpoint will host a conference call today at 1:30 p.m. Pacific Time (4:30 p.m. Eastern Time) to review the company’s financial results for the fourth quarter and full year ended December 31, 2017. To access this call, dial (888) 394-8218 for the U.S. or Canada, or (323) 794-2149 for international callers, with conference ID #7316893. A live webcast, and an archived recording of the conference call will be accessible from the Investors section of Proofpoint’s website at investors.proofpoint.com. An audio replay of this conference call will also be available through February 20, 2018, by dialing (844) 512-2921 for the U.S. or Canada or (412) 317-6671 for international callers, and entering passcode #7316893.
About Proofpoint, Inc.
Proofpoint Inc. (NASDAQ:PFPT) is a leading next-generation security and compliance company that provides cloud-based solutions to protect the way people work today. Proofpoint solutions enable organizations to protect their users from advanced attacks delivered via email, social media and mobile apps, protect the information their users create from advanced attacks and compliance risks, and respond quickly when incidents occur. More information is available at www.proofpoint.com.
Proofpoint is a trademark or registered trademark of Proofpoint, Inc. in the U.S. and other countries. All other trademarks contained herein are the property of their respective owners.
Forward-Looking Statements
This press release contains forward-looking statements that involve risks and uncertainties. These forward-looking statements include statements regarding momentum in the company’s business, market position, win rates and renewal rates, future growth, and future financial results. It is possible that future circumstances might differ from the assumptions on which such statements are based. Important factors that could cause results to differ materially from the statements herein include: failure to maintain or increase renewals and increased business from existing customers and failure to generate increased business through existing or new channel partner relationships; uncertainties related to continued success in sales growth and market share gains; failure to convert sales opportunities into definitive customer agreements; risks associated with successful implementation of multiple integrated software products and other product functionality; competition, particularly from larger companies with more resources than Proofpoint; risks related to new target markets, new product introductions and innovation and market acceptance thereof; the ability to attract and retain key personnel; potential changes in strategy; risks associated with management of growth; lengthy sales and implementation cycles, particularly in larger organizations; the time it takes new sales personnel to become fully productive; unforeseen delays in developing new technologies and the uncertain market acceptance of new products or features; technological changes that make Proofpoint's products and services less competitive; security breaches, which could affect our brand; the costs of litigation; the impact of changes in foreign currency exchange rates; the effect of general economic conditions, including as a result of specific economic risks in different geographies and among different industries; risks related to integrating the employees, customers and technologies of acquired businesses; assumption of unknown liabilities from acquisitions; ability to retain customers of acquired entities; and the other risk factors set forth from time to time in our filings with the SEC, including our Quarterly Report on Form 10-Q for the three months ended September 30, 2017, and the other reports we file with the SEC, copies of which are available free of charge at the SEC's website at www.sec.gov or upon request from our investor relations department. All forward-looking statements herein reflect our opinions only as of the date of this release, and Proofpoint undertakes no obligation, and expressly disclaims any obligation, to update forward-looking statements herein in light of new information or future events.
Computational Guidance on Earnings Per Share Estimates
Accounting principles require that EPS be computed based on the weighted average shares outstanding ("basic"), and also assuming the issuance of potentially issuable shares (such as those subject to stock options, convertible notes, etc.) if those potentially issuable shares would reduce EPS ("diluted").
The number of shares related to options and similar instruments included in diluted EPS is based on the "Treasury Stock Method" prescribed in Financial Accounting Standards Board ("FASB") ASC Topic 260, Earnings Per Share ("FASB ASC Topic 260"). This method assumes a theoretical repurchase of shares using the proceeds of the respective stock option exercise at a price equal to the issuer's average stock price during the related earnings period. Accordingly, the number of shares includable in the calculation of diluted EPS in respect of stock options and similar instruments is dependent on this average stock price and will increase as the average stock price increases.
The number of shares includable in the calculation of diluted EPS in respect of convertible senior notes is based on the "If Converted" method prescribed in FASB ASC Topic 260. This method assumes the conversion or exchange of these securities for shares of common stock. In determining if convertible securities are dilutive, the interest savings (net of tax) subsequent to an assumed conversion are added back to net earnings. The shares related to a convertible security are included in diluted EPS only if EPS as otherwise calculated is greater than the interest savings, net of tax, divided by the shares issuable upon exercise or conversion of the instrument. Accordingly, the calculation of diluted EPS for these instruments is dependent on the level of net earnings. Each series of convertible securities is considered individually and in sequence, starting with the series having the lowest incremental earnings per share, to determine if its effect is dilutive or anti-dilutive.
Non-GAAP Financial Measures
We have provided in this release financial information that has not been prepared in accordance with GAAP. We use these non-GAAP financial measures internally in analyzing our financial results and believe they are useful to investors, as a supplement to GAAP measures, in evaluating our ongoing operational performance. We believe that the use of these non-GAAP financial measures provides an additional tool for investors to use in evaluating ongoing operating results and trends and in comparing our financial results with other companies in our industry, many of which present similar non-GAAP financial measures to investors.
Non-GAAP financial measures should not be considered in isolation from, or as a substitute for, financial information prepared in accordance with GAAP. Investors are encouraged to review the reconciliation of these non-GAAP financial measures to their most directly comparable GAAP financial measures below. As previously mentioned, a reconciliation of our non-GAAP financial measures to their most directly comparable GAAP measures has been provided in the financial statement tables included below in this press release.
Non-GAAP gross profit and gross margin. We define non-GAAP gross profit as GAAP gross profit, adjusted to exclude stock-based compensation expense and the amortization of intangibles associated with acquisitions. We define non-GAAP gross margin as non-GAAP gross profit divided by GAAP revenue. We consider these non-GAAP financial measures to be useful metrics for management and investors because they exclude the effect of non-cash charges that can fluctuate for Proofpoint, based on timing of equity award grants and the size, timing and purchase price allocation of acquisitions so that our management and investors can compare our recurring core business operating results over multiple periods. There are a number of limitations related to the use of non-GAAP gross profit and non-GAAP gross margin versus gross profit and gross margin, in each case, calculated in accordance with GAAP. For example, stock-based compensation has been and will continue to be for the foreseeable future a significant recurring expense in our business. Stock-based compensation is an important part of our employees' compensation and impacts their performance. In addition, the components of the costs that we exclude in our calculation of non-GAAP gross profit and non-GAAP gross margin may differ from the components that our peer companies exclude when they report their non-GAAP results. Management compensates for these limitations by providing specific information regarding the GAAP amounts excluded from non-GAAP gross profit and non-GAAP gross margin and evaluating non-GAAP gross profit and non-GAAP gross margin together with gross profit and gross margin calculated in accordance with GAAP.
Non-GAAP operating loss. We define non-GAAP operating loss as operating loss, adjusted to exclude stock-based compensation expense and the amortization of intangibles and costs associated with acquisitions and litigation. Costs associated with acquisitions include legal, accounting, and other professional fees, as well as changes in the fair value of contingent consideration obligations. We consider this non-GAAP financial measure to be a useful metric for management and investors because they exclude the effect of stock-based compensation expense and the amortization of intangibles and costs associated with acquisitions and litigation so that our management and investors can compare our recurring core business operating results over multiple periods. There are a number of limitations related to the use of non-GAAP operating loss versus operating loss calculated in accordance with GAAP. For example, as noted above, non-GAAP operating loss excludes stock-based compensation expense. In addition, the components of the costs that we exclude in our calculation of non-GAAP operating loss may differ from the components that our peer companies exclude when they report their non-GAAP results of operations, and some of these items are cash-based. Management compensates for these limitations by providing specific information regarding the GAAP amounts excluded from non-GAAP operating loss and evaluating non-GAAP operating loss together with operating loss calculated in accordance with GAAP.
Non-GAAP net loss. We define non-GAAP net loss as net loss, adjusted to exclude stock-based compensation expense, amortization of intangibles, costs associated with acquisitions and litigation, non-cash interest expense related to the convertible debt discount and issuance costs for the convertible debt offering, loss on conversion of convertible debt, and tax effects associated with these items. We consider this non-GAAP financial measure to be a useful metric for management and investors for the same reasons that we use non-GAAP operating loss. However, in order to provide a complete picture of our recurring core business operating results, we also exclude from non-GAAP net loss the tax effects associated with stock-based compensation and the amortization of intangibles and costs associated with acquisitions and litigation, non-cash interest expense related to the convertible debt discount and issuance costs for the convertible debt offering, and loss on conversion of convertible debt.
In order to provide a complete picture of our recurring core business operating results, we also compute the tax effect of the adjustments used in determining our non-GAAP results by calculating an adjusted tax provision which considers the current and deferred tax impact of the adjustments. The adjusted tax provision reflects all of the relevant impacts of the adjustments, inclusive of those items that have an impact to the effective tax rate, current provision and deferred provision. As a result of the varying impacts of each item, the effective tax rate for the adjusted tax provision will vary period over period as compared to the GAAP tax provision. The adjusted tax provision is then compared to the GAAP tax provision, and the difference is reflected as “income tax benefit (expense)” in the reconciliation between GAAP net loss/income and Non-GAAP net loss/income.
Billings. We define billings as revenue recognized plus the change in deferred revenue from the beginning to the end of the period, but excluding additions to deferred revenue from acquisitions. We consider billings to be a useful metric for management and investors because billings drive deferred revenue, which is an important indicator of the health and visibility of our business, and has historically represented a majority of the quarterly revenue that we recognize. There are a number of limitations related to the use of billings versus revenue calculated in accordance with GAAP. Billings include amounts that have not yet been recognized as revenue, but exclude additions to deferred revenue from acquisitions. We may also calculate billings in a manner that is different from other companies that report similar financial measures. Management compensates for these limitations by providing specific information regarding GAAP revenue and evaluating billings together with revenues calculated in accordance with GAAP.
Free cash flow. We define free cash flow as net cash provided by operating activities minus capital expenditures. We consider free cash flow to be a liquidity measure that provides useful information to management and investors about the amount of cash generated by the business that, after the acquisition of property and equipment, can be used for strategic opportunities, including investing in our business, making strategic acquisitions, and strengthening the balance sheet. Analysis of free cash flow facilitates management's comparisons of our operating results to competitors' operating results. A limitation of using free cash flow versus the GAAP measure of net cash provided by operating activities as a means for evaluating our company is that free cash flow does not represent the total increase or decrease in the cash balance from operations for the period because it excludes cash used for capital expenditures during the period. Management compensates for this limitation by providing information about our capital expenditures on the face of the cash flow statement and in the "Management's Discussion and Analysis of Financial Condition and Results of Operations - Liquidity and Capital Resources" section of our quarterly and annual reports filed with the SEC.

Media Contact
Kristy Campbell
Proofpoint, Inc.
408-517-4710
Investor Contact
Jason Starr
Proofpoint, Inc.
408-585-4351


