
In my first blog, “Quickly Identify and Mitigate Risks with Compliance Risk Dashboard”, we described how the dashboard could provide a more holistic approach to compliance oversight, and in particular, how Supervisors can use a people-centric approach to pinpoint what major risks need to be investigated further. In this blog, we’ll pivot a bit and explain how the dashboard can provide deeper insights by analyzing organizational trends over time.
Have you ever contemplated what supervision rules were flagged over a given time? Have you wondered how your compliance risk profile has evolved, or not, since the start of the COVID-19 pandemic? Without the right tool, you might not even know where to start. With Proofpoint’s Compliance Risk Dashboard (as shown in the screenshot below), you can immediately glean insights that can help answer these questions by viewing Confirmed Flag Trends.
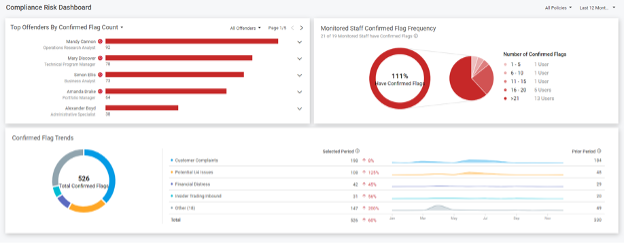
As with our previous blog, we’ll illustrate this with a hypothetical case study, except this time with Compliance Officer Jones. She’s completing a 12-month trending analysis of the Compliance Division using the Compliance Risk Dashboard. The dashboard immediately highlights the Top Confirmed Flagging Rule Trends for a Compliance Division and visually reflects any activity spikes for these rules.
Using the Dashboard, Jones can determine what flagging rules are driving the most confirmed activity within the entire Compliance Division. For example, Jones’s review of the confirmed flagging trends reflects that, within the past 12-months, Customer Complaints, Potential U4 Issues, Financial Distress, Insider Trading Inbound and Other are the top 5 confirmed flagging rules. As a reminder, flagged rules highlighted here would have been created using Proofpoint Supervision, an Add On for Proofpoint Archive. More than 150 out-of-box rules, spanning all regulations and regulatory bodies, are included with Proofpoint Supervision. Customers can use these rules as needed to meet business and regulatory requirements or create their own.
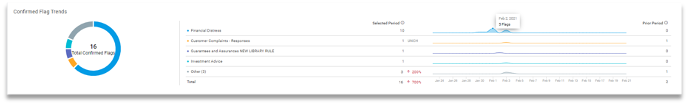
Looking closer at the trends allows Jones to pinpoint the exact time frames when Confirmed Flag Activity has occurred. For example, in the screenshot below, the metrics from the Dashboard indicate confirmed message trends for the Financial Distress flagging rule started in February 2021.
Based on the trends identified for the Compliance Division, Jones investigated the top activity. Jones initiated searches and determined the activity related to Customer Complaint, Potential U4 Issues and Financial Distress was of major concern. This activity was associated with one Advisor, Amanda Drake. The investigation noted several messages were flagged which were escalated in a very short period, including email threads that exposed Drake specifically asking separate customers to borrow money, which is prohibited.
As you can see, the dashboard allowed Compliance Officer Jones to quickly identify, investigate and act on a serious regulatory issue and potentially avoid a fine, negative company exposure and possibly more. And with this hypothetical story, I hope you can see how it can help you mitigate compliance risk for your organization.
The Compliance Risk Dashboard can make potential adverse trends more apparent, because Compliance professionals like Jones, or you, can visually see where their potential risks lie and spend time focusing on them. For more information about the Compliance Risk Dashboard and Proofpoint Supervision, view the datasheet.