
Proofpoint recently published the Threat Report for December 2014. Since this report includes statistics for email volumes and threats for all of 2014, this is a good opportunity to compare 2014 with the previous year and highlight some noteworthy trends that emerged in the email threat landscape last year.
Looking back over 2014, Proofpoint detected an overall drop in the indexed daily volume of unsolicited messages, with the average daily volume trending down 56% between January and the end of December. Strikingly, the bulk of the overall decrease for the year occurred after June 2014, with two notable drops: one around June and a second in September, corresponding to the disruptions of the GameoverZeus and Kelihos botnets, respectively. We noticed at the time almost immediate decreases in malicious unsolicited email traffic and wondered with others whether the effects of disruptions would be lasting, and now looking back on the year it appears that they were.
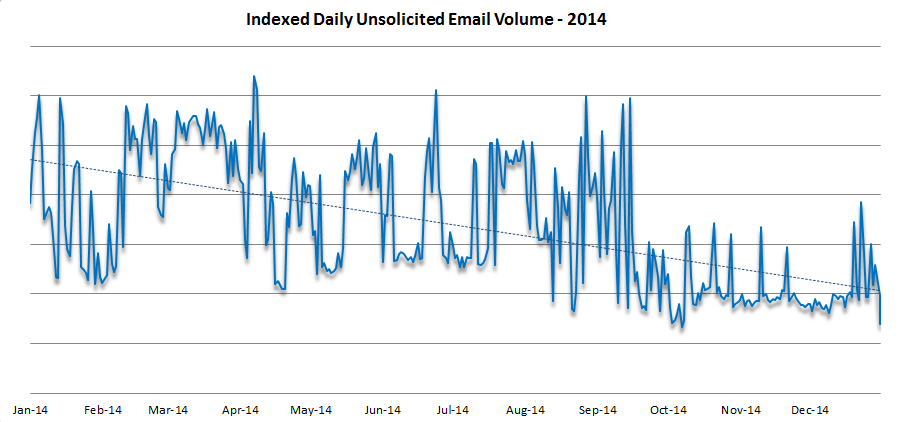
Figure 1: Indexed daily unsolicited email message volume, January-December 2014
This downward trend is all the more striking when compared with a similar view of 2013, from our December 2013 Threat Report.
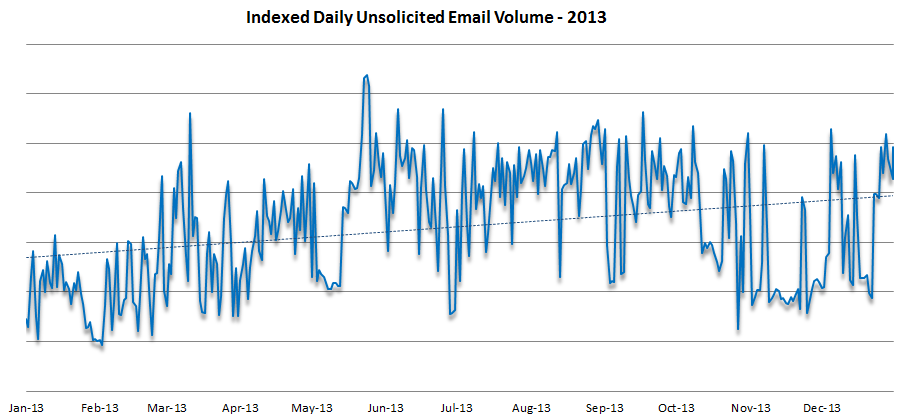
Figure 2: Indexed daily unsolicited email message volume, January-December 2013
As the chart shows, over the course of 2013 we saw an overall increase – albeit uneven and not as steep – in the indexed daily volume of unsolicited email, yielding a 16% overall increase from the end of 2012 through December 2013. This overall decrease seems counterintuitive in light of the number and severity of data breaches and compromises that were made public in the second half of 2014, and may well be the bright spot in the email threat picture, however, for what was lost in volume was more than made up for in maliciousness.
As we initially described in September, in 2014 Proofpoint detected a surge in the percentage of malicious URLs in unsolicited emails: that is, a higher proportion of the URLs contained in unsolicited emails were determined to be malicious. After a sustained surge in mid-2014, the average returned to longer-term levels (approx. 10 percent) but with the “new normal” of extremely high spikes over multiple days, including multiple occasions where the percentage of malicious URLs in unsolicited emails exceeded 40 percent. (Fig. 3)
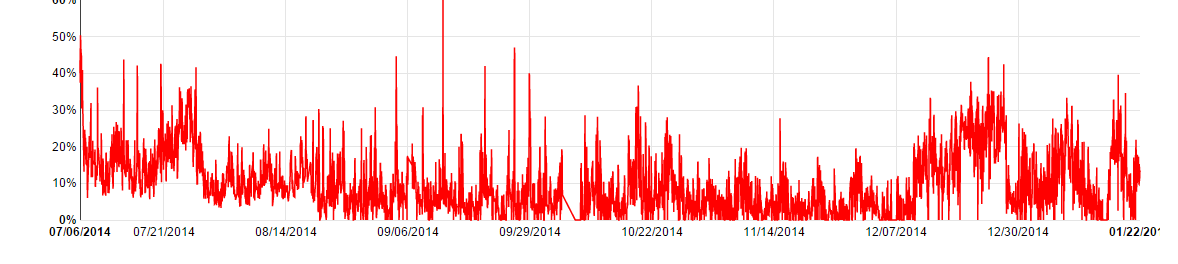
Figure 3: Percentage of URLs that are malicious, July 2014-January 2015
The latter part of 2014 saw a return to the elevated levels of mid-2014, but with an increased use of distinct malicious URLs. (Fig. 4)
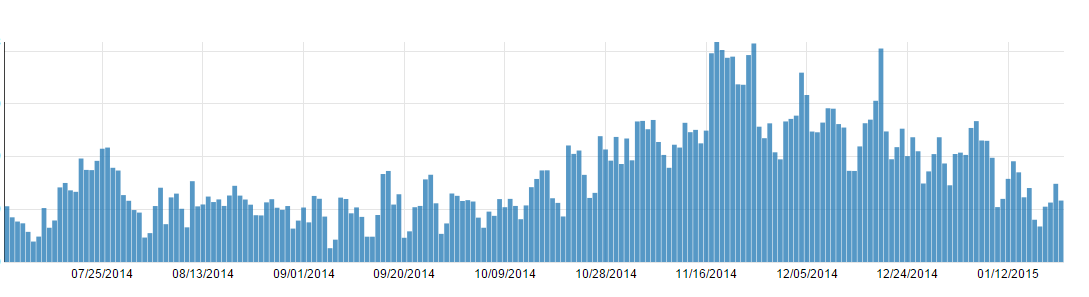
Figure 4: Volume of distinct malicious URLs, July 2014-January 2015
In other words, even as the overall volume of unsolicited email was hitting its low point in late 2014, 1) there was an increase in maliciousness of URLs, and 2) attackers were generating a larger number of URLs (and sending each to a smaller number of recipients) in order to improve their chances of evading blocking by URL reputation filters, and URLs pulled in malware that was generally more sophisticated. (We saw a similar pattern with attachments in the case of the 305 Dridex botnet that we described recently.)
The increased threat at the end of 2014 came not only from malicious URLs, but also from attachments, as the overall volume of messages with malicious attachments surged in December 2014 as part of a large and ongoing campaign. (Fig. 5)
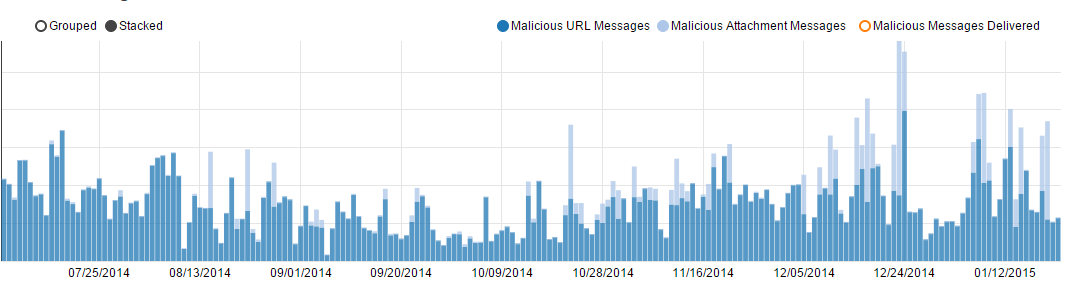
Figure 5: Trend of malicious messages detected, July-December 2014
As the chart shows, malicious attachments played a much larger role in the campaigns at the end of 2014, driven by the massive volumes of attachments and messages delivered by the Dridex campaigners as well as other botnets. Consistent with the trend of 2014, and particularly in the latter half of 2014, these were often Word documents with macro-enabled exploits designed to download a banking Trojan onto the victim’s computer, but these were not the only ones.
And who was sending these messages? Looking back at the December 2013 Proofpoint Threat Report, we see that the top-five countries sending unsolicited email were fairly consistent over the second half of the year. (Fig. 6)
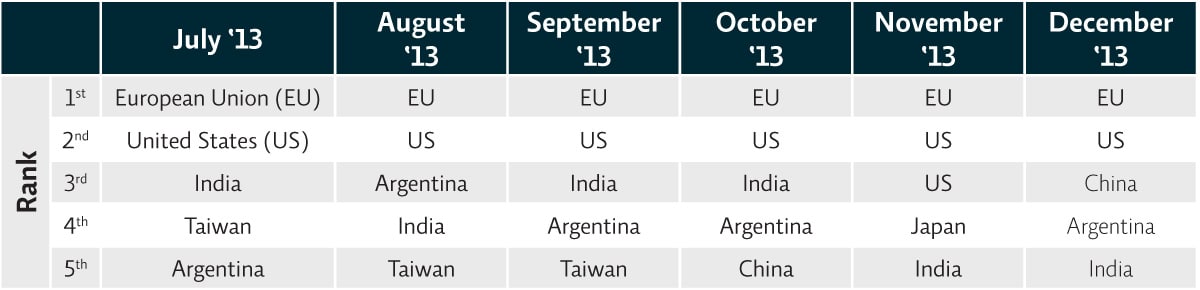
Figure 6: Top-5 sending countries, unsolicited email, July-December 2013
Moreover, the volume from each country as a percentage of total unsolicited email was relatively constant, with the EU consistently accounting for 13-16% of total unsolicited email, and the others accounting for single-digit percentages except for brief surges (such as China in November 2013, which jumped into second place with 12% of total unsolicited mail before slipping back to its normal levels).
This picture changed somewhat when compared to 2014. (Fig. 7)
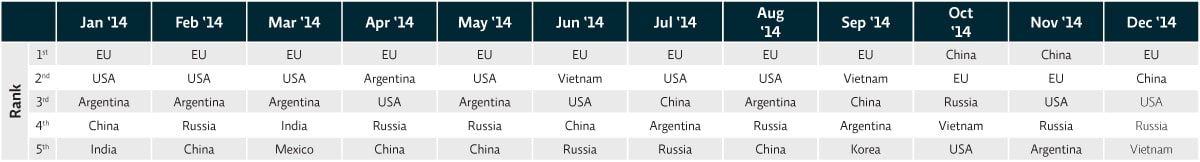
Figure 7: Top-5 sending countries, unsolicited email, January-December 2014
Not only did China surge into the top spot for two months at the end of the year, but there was greater variety in the sending countries. Russia consistently in the top-five, and Vietnam and Korea also made an appearance in the league tables, pushing India, Taiwan and Japan – and in September, even the US – out of the top-five. This reflects a shift in strategy by attackers as they distribute their networks more broadly and look beyond the US for a more reliable supply of unpatched and vulnerable computers that they can compromise.
In summary, 2014 saw a decrease in the overall volume of unsolicited email overshadowed by a dramatic increase in its maliciousness. At the same time, in 2014 the sources of unsolicited email became more distributed.
The public domain of cybersecurity mirrored what we saw in our data: without equivalents to the massive POS breaches at the end of 2013, 2014 gave us fewer overall records breached; but the overall severity of reported compromises exceeded anything in the previous year. From the attack on Sony to Regin to the continued rise of ransomware, whatever good news there might have been in 2014 was overwhelmed by a radical surge in destructiveness, as the increased maliciousness of unsolicited email was accompanied by the increased malice of the attackers.
To combat the trends that began and 2014 and will continue into 2015 and beyond, Proofpoint recommends that organizations:
- Adopt advanced threat solutions that utilize dynamic malware analysis and predictive analysis and can detect and stop the new generations of sophisticated threats that are able to easily evade traditional signature- and reputation-based defenses
- Automate your threat response in order to reduce the time from detection to containment: Modern threats are more destructive, fast-acting and numerous than most organizations expect, and it it is essential to be able to rapidly identify genuine, actionable incidents and respond quickly.
- Integrate security, content enforcement (encryption, DLP, etc) and archiving for email and social media in order to protect the two most valuable communication channels in every organization, and to defend the most-used and most-effective attack vector for cybercriminals and state-sponsored actors.