
Executive Summary
Every day, Proofpoint analyzes more than 5 billion email messages, hundreds of millions of social media posts, and more than 250 million malware samples as part of the company’s ongoing effort to protect organizations around the world from advanced and persistent threats.
Proofpoint’s researchers continue to observe and monitor sophisticated threats across email, social media, and the web, which provides a unique vantage point from which to reveal and analyze the Tactics, Techniques, and Procedures (TTPs) of today’s cyberattacks.
This report highlights the threats, trends, and key takeaways of threats Proofpoint’s research organization observes within its large customer base and the context of the broader threat landscape. It provides actionable intelligence organizations can use to combat today’s attacks better, anticipate emerging threats, and manage security awareness. Along with research and findings, the report recommends steps organizations can take to protect their people, data, and brands.
Key Takeaways:
Emotet dominates while bankers, downloaders, and RATs continue to appear at scale
Below are the key takeaways from the fourth quarter of 2019.
-
Emotet made up 37% of all malicious payloads in 2019; in Q4, it appeared in 31% of all malicious messages
-
By way of comparison, Emotet made up 29% of all malicious payloads in 2018
-
As in 2018, banking Trojans followed Emotet in terms of overall malicious message volumes, comprising 26% of messages in 2019 and 22% in 2018. Top banking Trojans in 2019 were The Trick, Ursnif, and IcedID, vs. Panda Banker, Ursnif, URLZone, and The Trick in 2018.
-
For the full year, RATs made up almost 5% of malicious payloads, but in Q4, that number was over 9%, led by large SDBbot campaigns distributed consistently by TA505.
-
Ransomware continued to make up a tiny fraction of primary malicious payloads in email. Around 0.1% of malicious messages carried ransomware for both Q4 and the year as a whole, led by Gandcrab early in 2019 before the operators shut it down, to be succeeded by occasional Maze, FTCode, and Sodinokibi campaigns in Q4.
-
The trend favoring URLs instead of attachments in email continued throughout 2019, with 85% of malicious emails using links to distribute malware, vs 75% for 2018.
-
However, Q4 saw increases in overall volumes as well as a shift towards a higher proportion of emails bearing malicious attachments. In Q4, 35% of malicious emails bore attachments, driven largely by consistent hybrid Emotet campaigns that used both URLs and attachments and moderate- to high-volume campaigns from TA505 and others that frequently employed either attachments or hybrid approaches.
-
The proportion of live, active domains among identified fraudulent domains continued to outpace the proportion of active domains on the broader web; almost 83% of fraudulent domains returned an HTTP response in Q4, vs 43.5% of all domains.
-
Nearly 40% of fraudulent domains had an SSL certificate in Q4 2019, vs 26% in the same period of 2018. This compares to just 10% on the broader web.
-
The number of fraudulent sites with both SSL certificates and an active HTTP response also increased from Q3 2019 to Q4, from 16.2% to 25%.
Overview
Key stat: Emotet accounted for 31% of malicious payloads in email during the fourth quarter of 2019 and 37% of all malicious payloads for the full year.
Despite an extended second-quarter hiatus, Emotet remained the largest threat by message volume in 2019, accounting for 31% of malicious payloads during the fourth quarter and 37% for the entire year. Overall message volumes were up slightly in Q4 vs. Q3, driven by these consistent Emotet campaigns and relatively large campaigns featuring banking Trojans, downloaders, and remote access Trojans (RATs). Of note, however, was the continued absence of ransomware as a primary payload in email campaigns. Although strains of ransomware made headlines throughout Q4 and 2019 as a whole, most of these were secondary infections, with ransomware comprising just over 0.1% of malicious payloads in email.
The consistent moderate- to high-volume Emotet campaigns, as well as RAT campaigns from TA505 and actors distributing banking Trojans like Ursnif and The Trick also contributed a slight shift towards attachment-based malicious emails in Q4. While attachments still only appeared in 18% of these campaigns, many were often hybrid in nature, with total URL volumes off 6% from their Q3 high of 88% of all malicious emails.
Exploit kit activity peaked for the year at the end of Q3, with continued higher-than-normal levels into October. While still far below 2016 levels, EK activity has been associated with ongoing malvertising activity, with relatively consistent detections of RIG EK and a surge in Phoenix EK detections in Q4.
Domain fraud techniques also continued to evolve in Q4 with upticks in fraudulent domains making use of SSL certificates and noteworthy increases in fraudulent domains that both demonstrated an active HTTP response and had secure certificates.
Malware by the numbers
Key Stat: URL-based malicious messages comprised 82% of overall malicious message volumes in Q4
Overall message volume increased slightly in Q4, despite an expected seasonal decline in malicious activity in December. In Q4, 18% of malicious emails bore attachments, driven largely by consistent hybrid Emotet campaigns that used both URLs and attachments and moderate- to high-volume campaigns from TA505 and others that frequently employed either attachments or hybrid approaches. In Q3 2019, only 12% of malicious messages used attachments to distribute malware. However, the overall trend towards the predominant use of URLs remained clear; In Q4 2018, 32% of malicious messages used attachments. URLs range from relatively common Microsoft SharePoint, Google Drive, Dropbox, and other cloud service links to attacker-controlled domains. Figures 1 and 2 show the ongoing dominance of URL-based email threats, both in Q4 and quarter-over-quarter.
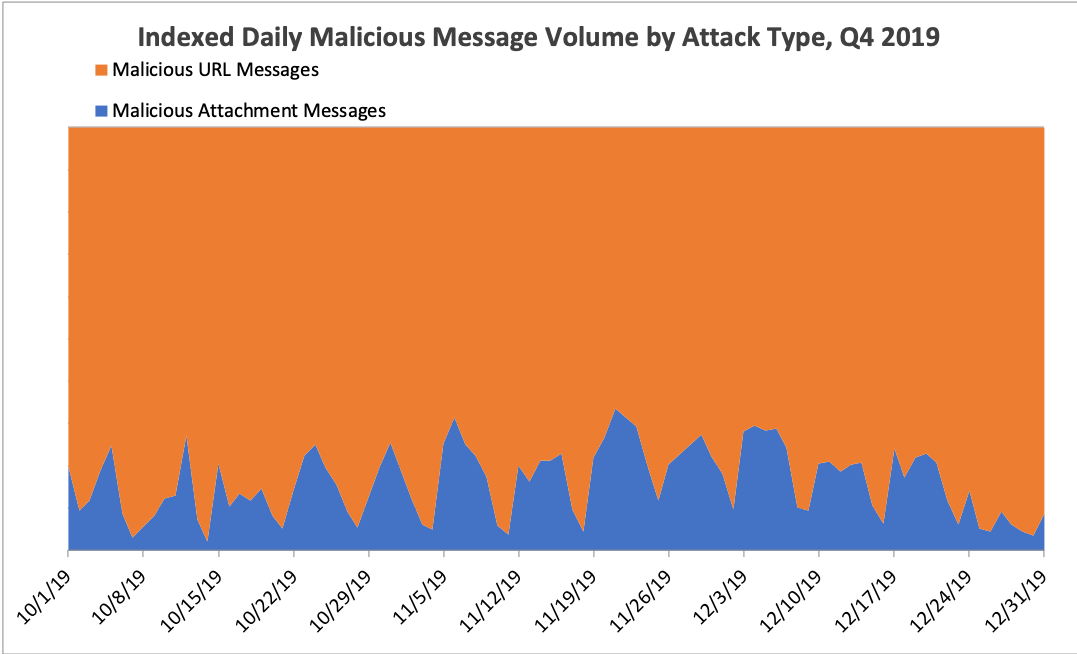
Figure 1: Indexed relative volume of malicious messages with attachment-based vs. URL-delivered payloads, Q4 2019
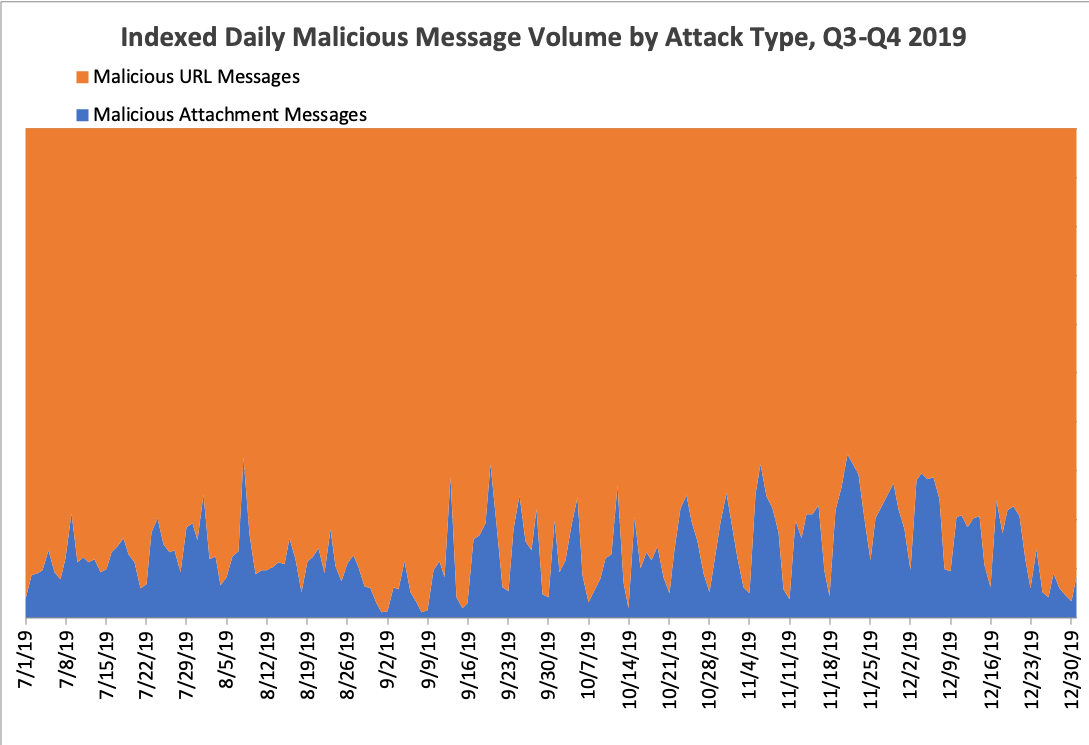
Figure 2: Indexed relative volume of malicious messages with attachment-based vs. URL-delivered payloads, Q3 and Q4 2019
Figure 3 shows the overall distribution of message volumes by malware family in Q4. Aside from a hiatus for most of Q3 2019, Emotet — by far the largest contributor we track to the botnet family — has been nearly a constant feature in the landscape for the last two years. In 2018, we classified Emotet as a banking Trojan, but the malware has now evolved into a modularized dropper, operating and classified throughout 2019 as a botnet. For the purposes of comparison here, we reclassified Emotet as a banker in 2018 data.
Banking Trojans, downloaders, remote access Trojans (RATs), and credential stealers round out the top five families for Q4. Note, however, that The Trick (the top banking Trojan for the quarter) was frequently distributed as a secondary payload with Emotet, increasing the impact of Emotet’s 31% share of the landscape, given its significant contribution to banking Trojan volumes.
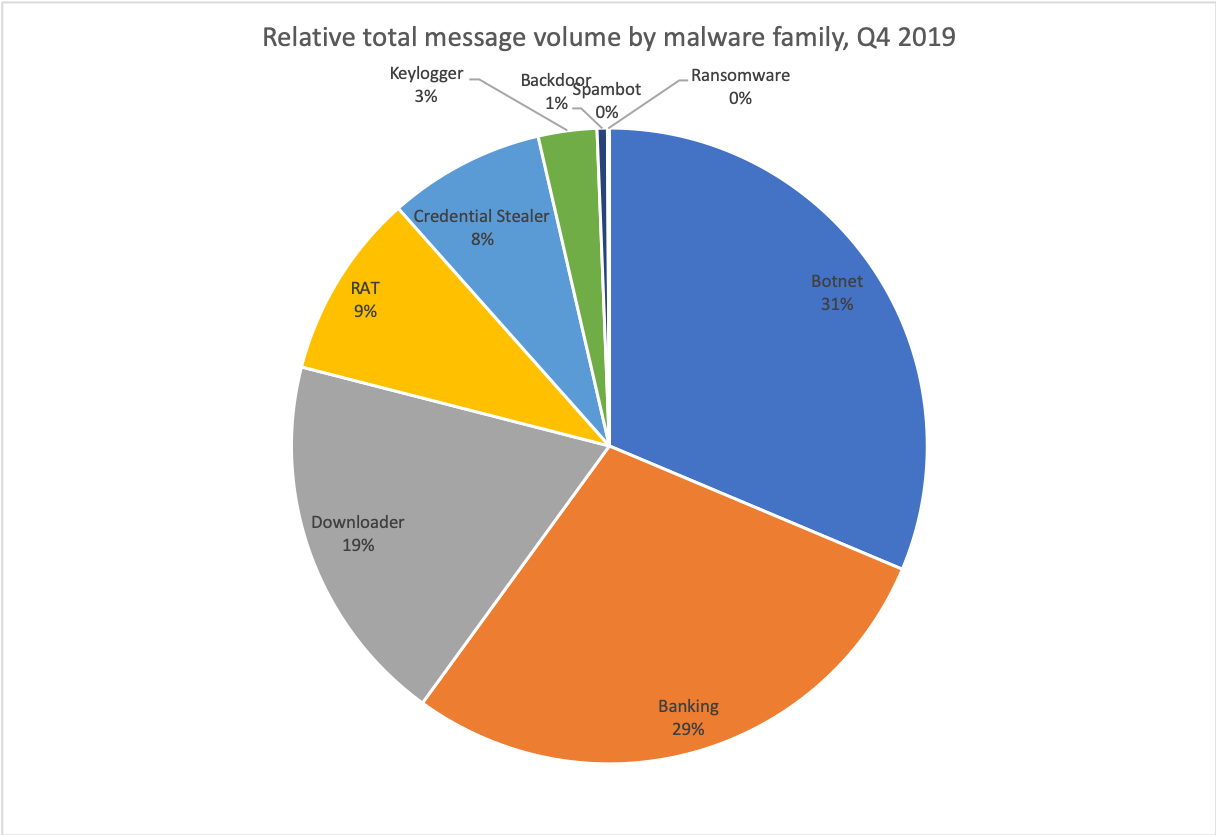
Figure 3: Relative message volumes associated with the top malware families in Q4 2019
Figure 4 illustrates the quarterly shifts in payloads by malware family for 2019. With the exception of Q3’s Emotet hiatus, during which increased banking Trojan and RAT volumes largely made up for the reduced botnet volume, a few key trends emerged through the year:
-
Slow decrease in Emotet relative to other payloads (note that actual Emotet volumes were up in Q4 vs. Q2 but other malware appearing in high volumes diluted the contribution of the botnet family, of which Emotet was the primary component in 2019, to overall volumes).
-
Steady increases in banking Trojans, downloaders, and RATs relative to other malware.
-
The continued absence of ransomware as a primary payload in email.
In general, though, actors continue to focus on distributing versatile malware designed to reside undetected on compromised machines to collect credentials, conduct reconnaissance, move laterally on networks, and enable at-will distribution of secondary payloads.
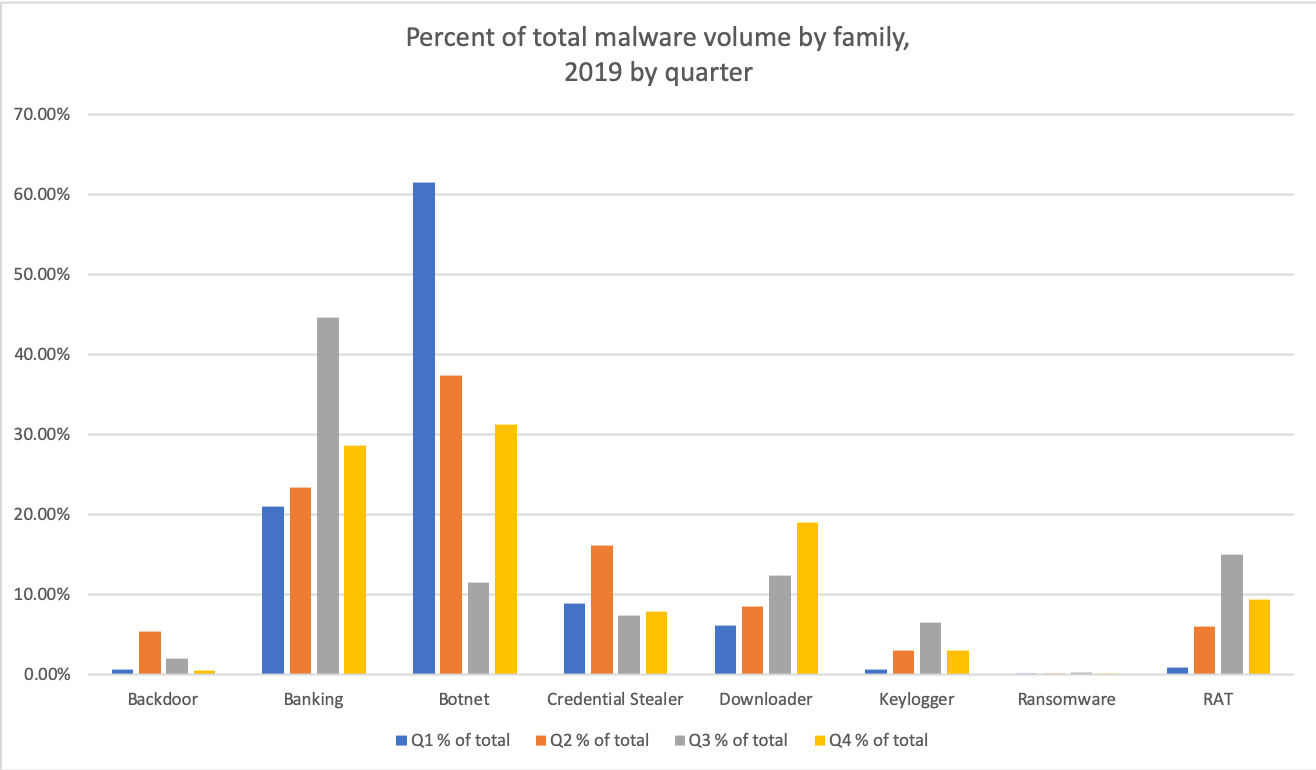 Figure 4: Quarterly comparisons of malicious message volume by malware family, 2019
As we have seen in recent quarters, particularly after the March 2019 shutdown of GandCrab, ransomware was virtually absent in Q4, with occasional small Maze and FTCode email campaigns. However, high-profile ransomware attacks against hospitals, municipalities, and similar targets appear to generally be the result of prior compromise with RATs, downloaders, and other versatile malware as noted above.
Emotet has a few new Tricks while TA505 focuses on SDBBot
Key stat: The Trick accounted for over 72% of all banking Trojan payloads in email in Q4.
Emotet and the Trick were the top two malware strains distributed via email in Q4 2019, comprising over half of all malicious payloads during the quarter. The Trick accounted for 72% of all banking Trojan payloads (Figure 6) and 20% of all payloads tracked by Proofpoint researchers during this period. However, 92% of The Trick payloads were secondary payloads to Emotet. Most campaigns involving The Trick independent of Emotet were lower volume.
Thus, while Emotet distribution as a percentage of all malicious payloads distributed via email in Q4 2019 was down from the same period last year (43% in Q4 2018), the malware’s use as a loader contributed significantly to distribution of The Trick and overall increases in banking Trojan volumes.
While The Trick banking Trojan (also known as Trickbot) was particularly prevalent in Q4, the malware was the most common banking Trojan for all of 2019 as well (Figure 5). For the year, Ursnif and IcedID were also common in email campaigns, while Ursnif and Dridex took the second and third spots in Q4. Ursnif volumes in particular were driven by multiple actors consistently distributing various affiliate IDs of the banker in consistent daily campaigns.
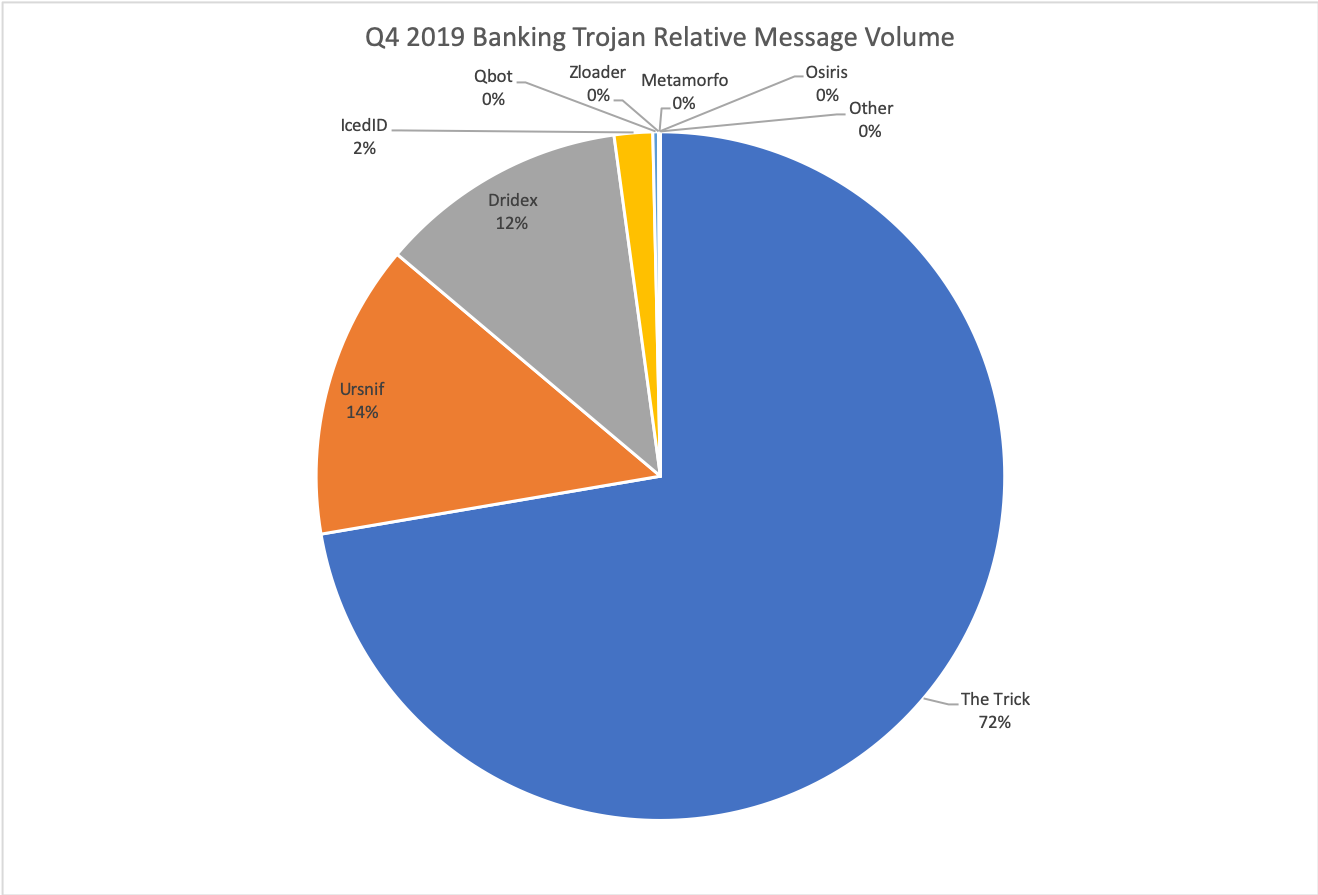
Figure 5: Relative banking Trojan volumes distributed via email in Q4
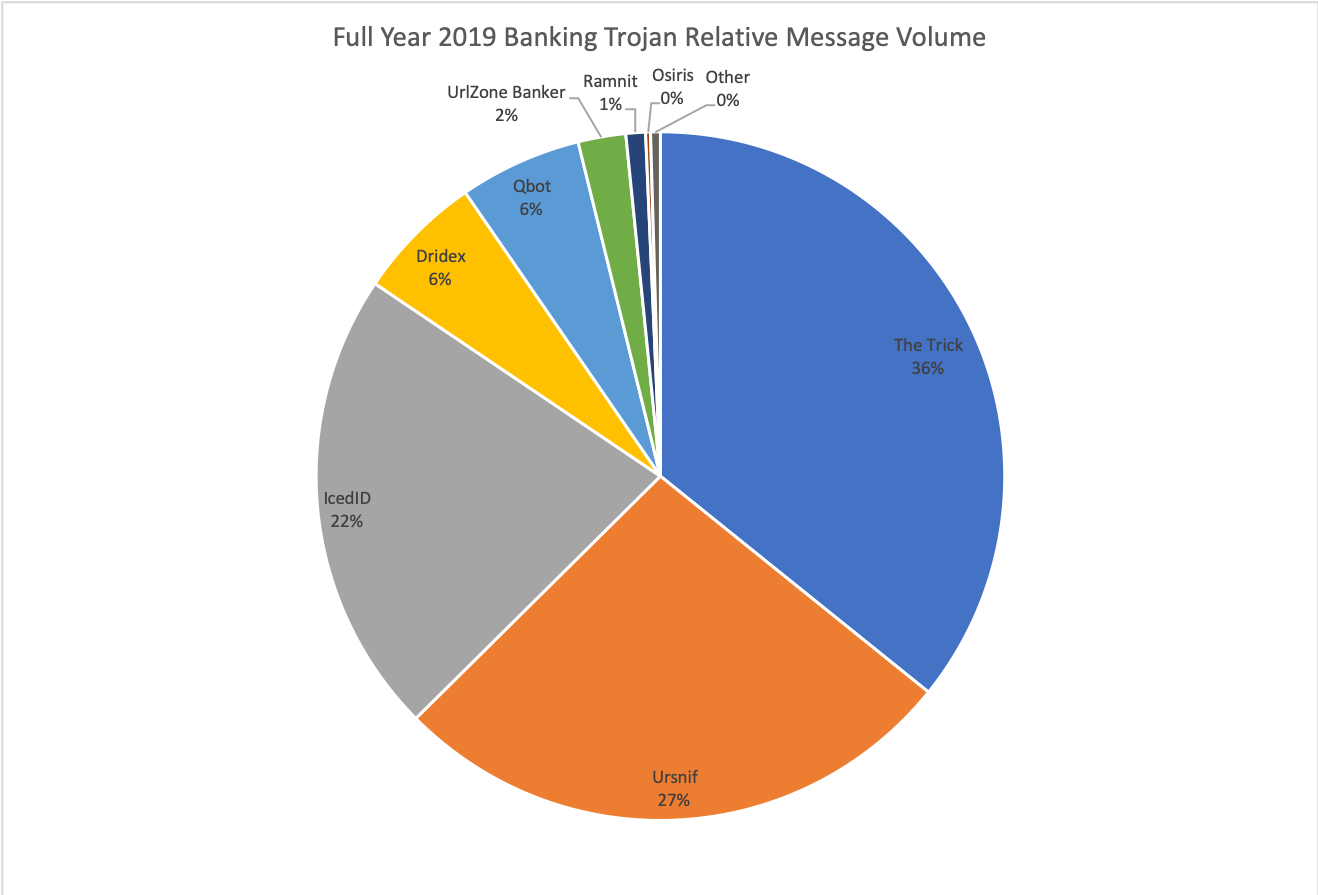
Figure 6: Relative banking Trojan volumes distributed via email throughout 2019
In Q3, RATs reached their highest levels relative to other malware families, but this was largely due to the absence of Emotet for much of the quarter. RAT volumes in Q4 actually increased almost 70% over Q3, despite over a five percentage point decrease relative to other families. The volume increase was primarily driven by more aggressive, larger campaigns from TA505, which switched its most common payload to the SDBbot RAT. In addition to larger and more frequent campaigns, the group also expanded its target geographies, with more regular campaigns in Korea, Japan, China, and more. SDBbot accounted for 85% of all RAT volumes in Q4 (Figure 7), up from 75% in Q3. NanoCore and NetWire, frequently distributed by smaller crimeware actors, made up 10% of RAT volume together.
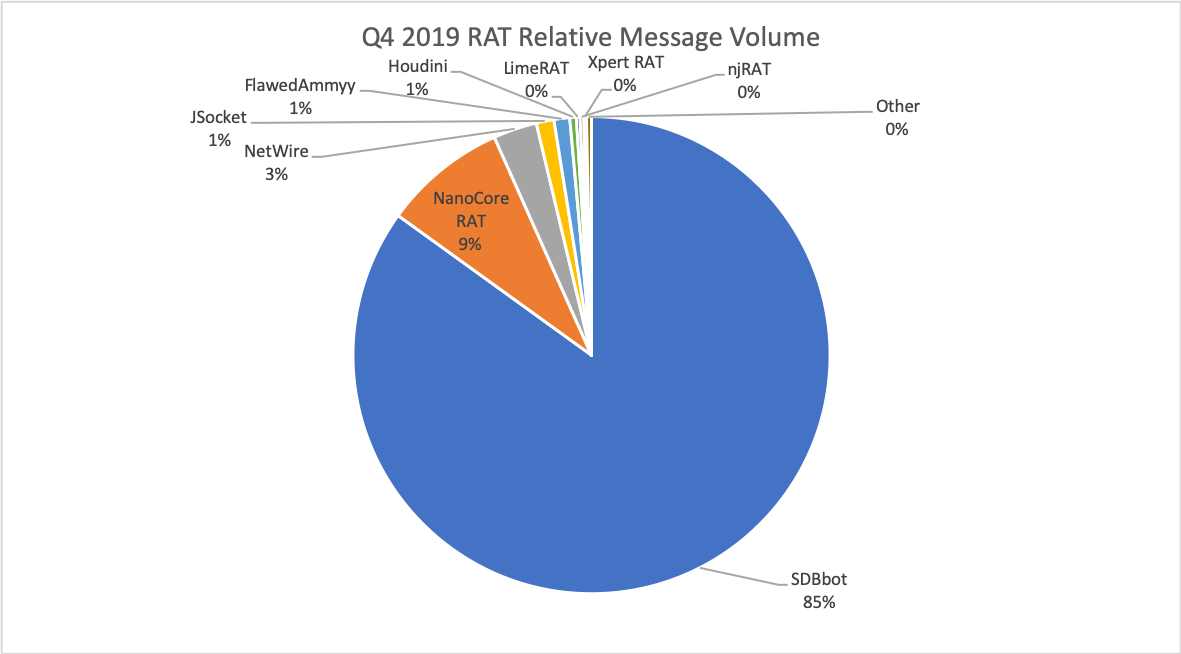
Figure 7: Relative RAT volumes distributed via email in Q4
Point-of-Sale Malware: Consistent inconsistency
Key stat: FindPOS accounted for almost 44% of all detected POS malware activity.
In past years, Proofpoint researchers have frequently observed spikes in Point-of-Sale (POS) malware – malware designed to steal credit card information from terminals and payment systems – around Black Friday as threat actors apparently geared up for the holiday shopping season. In 2019, our worldwide sensor network detected a range of credit card exfiltration activity, phone home beacons, and more from several strains of POS malware including ZeusPOS, FindPOS, MagickPOS, and NewPOSThings throughout the year. In Q4, we also noted a spike in Alina/JackPOS activity on Black Friday (Figure 8). FindPOS in particular accounted for nearly 44% of all detected POS malware activity for the year.
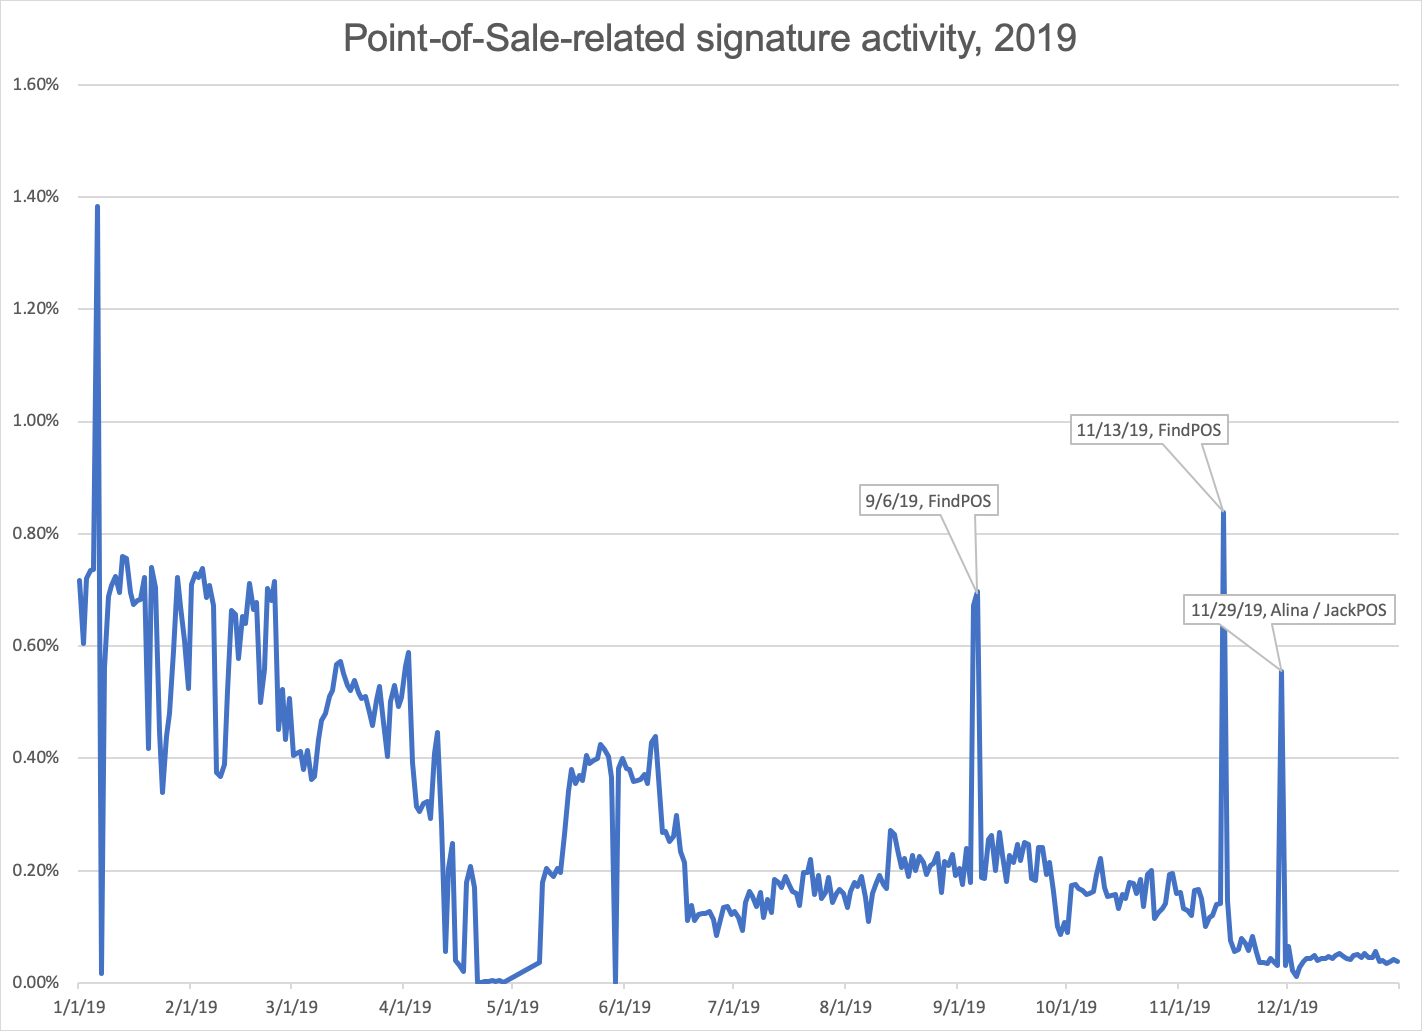
Figure 8: POS malware activity detection for full-year 2019
ZeusPOS appeared to be quite active through June, with periods of relative quiet through the end of the year. Two exceptions occurred mid-August, with a surge in moderate activity and a very large spike in detected activity on November 10. FindPOS, on the other hand, showed large spikes in mid-January, early September, and mid-November, with sustained moderate activity during Q1. We also observed instances of attackers attempting to access POS systems using Microsoft Remote Desktop Protocol (RDP).
While the limited date range of this data precludes drawing broad conclusions, there are a couple of important takeaways:
-
Point-of-sale attacks are increasingly less seasonal in nature and widespread throughout the year, even as individual POS malware strains ebb and flow in terms of activity.
-
While the exact method of installation varies, organizations and their supply chain partners are frequently compromised initially via RAT and backdoor infections propagated in email.
-
RDP is increasingly being used against legacy Microsoft Windows-based terminals, along with brute force attacks against SaaS installations to facilitate lateral movement and expansion., necessitating isolation of terminals on networks.
-
Much of the common POS malware in circulation relies on swiped credit cards, indicating that more complete and consistent adoption and use of chip and PIN technologies will have a measurable effect on the success of POS malware infections.
Domain Threats
Key Stat: Nearly 40% of fraudulent domains had an SSL certificate in Q4 2019, vs 26% in the same period of 2018.
Given the ongoing high proportions of URL-based message threats, domain threats are increasingly important trends to track. Fraudulent and suspicious domains are used for everything from malware distribution to affiliate spam, brand abuse, and malvertising, creating a range of risks for organizations and consumers.
Of note in Q4, the proportion of live, active domains among identified fraudulent domains continued to outpace the proportion of active domains on the broader web; almost 83% of fraudulent domains returned an HTTP response in Q4, vs 43.5% of all domains.
As we have noted in the past, the number of fraudulent domains with an SSL certificate is also disproportionately higher than what we observe across web domains and continues to rise. A snapshot of all domains at the end of Q4 showed that 10% had installed a secure certificate, required to enable secure communications between website operators and visitors. However, almost 40% of domains identified as fraudulent had an SSL certificate in Q4, up from 26% in Q3 as well as in Q4 of 2018.
Interestingly, the number of fraudulent sites with both SSL certificates and an active HTTP response also increased from Q3 2019 to Q4, up almost nine percentage points to 25%.
|
Type of suspicious domain/web property |
% resolving to an IP address |
% with an HTTP response |
% with MX records |
% with an SSL certificate |
|
All domains: Q4 |
70% |
43.5% |
41% |
10% |
|
Fraudulent domains: Q4 |
85.9% |
82.9% |
23.2% |
39.5% |
|
Fraudulent domains: 2019 |
85.1% |
81.4% |
27.5% |
32% |
Table 1: A comparison of fraudulent and legitimate domains by resolvable IP addresses, MX records, and valid SSL certificates
These trends contribute dramatically to social engineering around these domains as users have been conditioned to look for the padlock icon as a sign of security and safety as they browse.
Similarly, lower implementation of MX records among fraudulent domains continues to suggest that threat actors only create such records if they intend to use the domains for email-based attacks.
Proofpoint Recommendations
This report provides insight into the shifting threat landscape that can help inform an organization’s cybersecurity strategy. Here are our top recommendations for how companies can protect their data, customers, and brands in the coming months.
- Assume users will click. Social engineering is increasingly the most popular way to launch email attacks and criminals continue to find new ways to exploit the human factor. Leverage a solution that identifies and quarantines both inbound email threats targeting employees and outbound threats targeting customers before they reach the inbox.
- Deploy robust layered defenses. Threats range from high-volume malware to highly-targeted, low volume business email compromise scams that often have no payload at all and are thus difficult to detect. Network and web-based threats may also affect users, while impostor threats require scalable solutions that defend against a variety of identity deception techniques and should, where possible, include full implementation of DMARC.
- Protect your brand reputation and customers. Fight attacks targeting your customers over social media, email, and mobile — especially fraudulent accounts that piggyback on your brand. Look for a comprehensive domain fraud solution that scans the web and reports fraudulent and suspicious activity.
- Partner with a threat intelligence vendor. Smaller, more targeted attacks call for sophisticated threat intelligence. Leverage a solution that combines static and dynamic techniques to detect new attack tools, tactics, and targets — and then learns from them.