
A convenient way for users to report phishing is through an abuse mailbox with an email address—for example, phishing@abccompany.net. While abuse mailboxes are effective, they often require back-and-forth between IT and users to gather critical details like email headers.
That’s why email reporting add-ins or buttons, like Proofpoint PhishAlarm, which feature simplicity and more functionality than an abuse mailbox, are becoming popular tools for reporting suspicious email messages.
Figure 1. Proofpoint PhishAlarm email reporting button
To compile the metrics for this blog post, which is the second in a series, we analyzed data from the millions of people using our PhishAlarm email reporting button.
Proofpoint also actively uses PhishAlarm data to help our customers benchmark against their peers, gain visibility into user behavior and improve their key performance indicators (KPIs). The streamlined phishing reporting workflow that PhishAlarm enables saves users and IT security teams time, while providing valuable insight into user resilience and the organization’s email security posture.
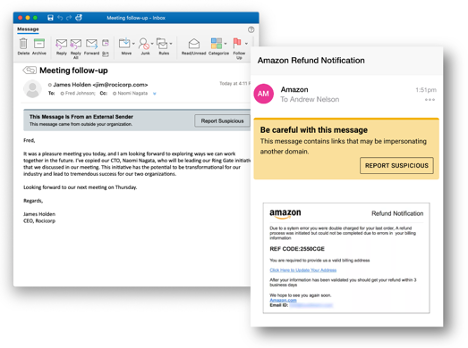
Figure 2. Proofpoint Email Warning Tags with Report Suspicious will provide customers an innovative way to help users improve their email reporting accuracy and provide enhanced email security.
While not in this data set, we’re excited to have data in the future about our Email Warning Tags with Report Suspicious functionality and how these improve reporting rates and accuracy. These HTML-based banners are contextual, customizable, and work with little to no IT overhead to help users spot and report suspicious messages.
Failure rate and reporting rate as user behavior measurements
While phishing simulations in security awareness programs have always been a popular tool for understanding user behavior, the “click rate” or “failure rate” of simulations is not an ideal measure of user behavior when it’s the only metric considered.
The failure rate is defined as the worst-case scenario based on the template type:
- Link-based template: User clicks on the link
- Attachment-based template: User opens the attachment
- Data entry/credential-based template: User submits credentials
Key callout: The failure rate alone doesn’t work well for measuring user behavior Why is this?:
- Different templates have widely varied click rates
- The rate demonstrates that users have avoided the bad, not “done the good”
- It’s only one metric; it does not paint a complete picture of user behavior
In our phishing simulation data, Proofpoint found widely varied failure rates for templates. Some less-challenging templates have low single-digit failure rates, for example, while others like the Netflix template shown have netted failure rates approaching 100% in certain campaigns.

Figure 3. Netflix simulated phishing email template
Adding information about the reporting rate of simulations is a better way to understand user behavior change, than looking at the failure rate alone. The reporting rate demonstrates that users are “doing the good” and helping to secure the organization. The higher your reporting rate, the more likely users are to report real suspicious messages for your IT security teams to resolve before greater damage is done.
Reporting rate alongside the failure rate: The resilience factor
So, what do you get when you combine the failure rate with the reporting rate? It’s what we call the resilience factor. Figure 3 shows the formula we use to determine the average resilience factor among our customers, which is 1.2.
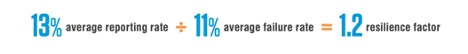
Figure 4. The average resilience factor of Proofpoint customers
We observed that the average reporting rate of phishing simulations among our customers was 13%. We’ve seen this rate improve every year as more organizations implement a phishing reporting add-in and communicate how to use it to their users. The average failure rate of 11% also ticked down slightly from last year.
The resilience factor can improve dramatically, as we’ve seen happen with many Proofpoint customers. We recommend a resilience factor of 14x, or an average reporting rate of 70% and a failure rate of 5% or under, as a stretch goal. We recommend customers use both metrics, as there is a limit to how low the failure rate can be (it will almost never be 0), and when you make campaigns more targeted and difficult the failure rate can vary drastically.
Top-performing customers have been able to achieve this 14x stretch resilience factor, which shows just how effective security education can be at changing user behavior. If your resilience factor is lower, know it will take time and ongoing security awareness engagements to change behavior.
The data set we used to calculate the average resilience factor also shows that the average number of messages reported per user was just over five annually. We expect this figure to grow significantly in the coming years as organizations ramp up their education initiatives and users become more accustomed to reporting suspicious messages.
A closer look at failure and click rates by industry and template type
Following is an overview of industry-specific data on failure and click rates that we collected, along with resilience factors that we calculated using the formula shown earlier. We found that financial services is the top-performing industry in terms of its reporting rate (20%). However, the legal industry has the highest overall resilience factor (2.1).
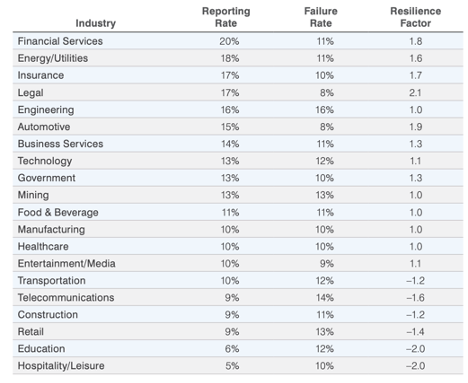
Figure 5. Failure and click rates broken down by industry
We also observed differences in failure and reporting rates by template type:
|
Template Type |
Reporting Rate Average |
Failure Rate Average |
Resilience Ratio Average |
|
Attachment |
18% |
20% |
.9 |
|
Data entry/credential |
15% |
4% |
3.8 |
|
Link |
13% |
12% |
1.1 |
Users are succeeding at reporting attachment-style templates the most often; however, these phishing simulations also have the highest failure rate, according to our analysis. While users may find attachments tempting because of the data in them (Covid exposure data, Employee bonus numbers, etc) in simulations, a certain segment of users may be more cautious and therefore reporting these types of attachment threats.
We also found that the resilience ratio for data entry/credential phishing simulations was much higher than the other two template types. (It’s worth noting that there’s an additional step with data entry/credential templates: To fail the phishing simulation test, users must click on the link and submit their credentials.)
Reporting rate distribution
Reporting rate performance depends on your organization’s security awareness maturity and how long users have been using an email reporting add-in or button. So, don’t be discouraged if after only a few months of your employees using the tool, your organization is not yet in the high-performing range. It takes time and effort to change user behavior and drive a security-aware organizational culture.
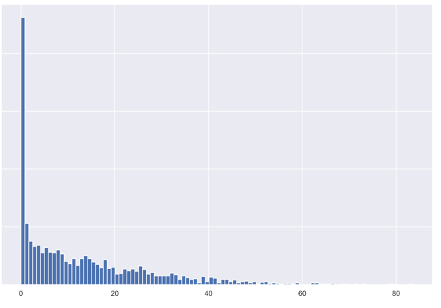
Figure 6. Y axis: Number of customers, X axis: Phishing reporting rate. This graph show the majority of customers fall into a low range of reporting rates, because reporting add-ins have low awareness and usage with the user population. Organizations can change this, however.
Many organizations fall into a very low range of reporting rates, which is normal.
Average reporting rate of simulations by percentile:
|
Percentile |
Percentage of users reporting simulations |
|
25% |
1.4% |
|
50% |
8.5% |
|
75% |
19.9% |
|
Average |
13% |
|
Top-performing |
83.6% |
With low reporting rates, we’ve often found that:
- Organizations are just implementing their email reporting add-ins
- Users may have multiple options to report messages (like an abuse mailbox address)
- User education does not include instructions for how to use an email reporting add-in
- Users instinctively delete or ignore messages they aren’t expecting
A little education can go a long way toward helping your organization raise the reporting rate. Including messaging in security awareness communications, providing instructions during security training on how to use the add-in, and providing users feedback when they submit simulated phishing messages can improve your reporting rate—and get you closer to being a top performer.
Understand how you benchmark against your peers
In the new, advanced CISO Dashboard from Proofpoint, you can see how your organization ranks (by percentile) for phishing simulation reporting. You’ll get context for how you benchmark against industry and other Proofpoint peers in real time, along with other critical security awareness metrics you can easily share with your chief information security officer (CISO) and other stakeholders
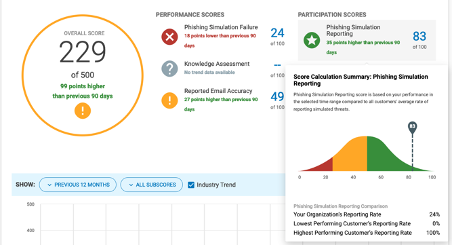
Figure 7. Phishing reporting scores and summaries
Let’s get real: What else are users reporting?
It’s a win for your organization whenever a user reports a phishing simulation. That’s the goal of the exercise, after all. But what happens when your users face real phishing messages?
In our next blog post, we’ll examine how effective users are at reporting real malicious messages and helping their organization to improve its security posture.