The Honey Stick Project Revisited: How Secure Are Your Mobile Devices?
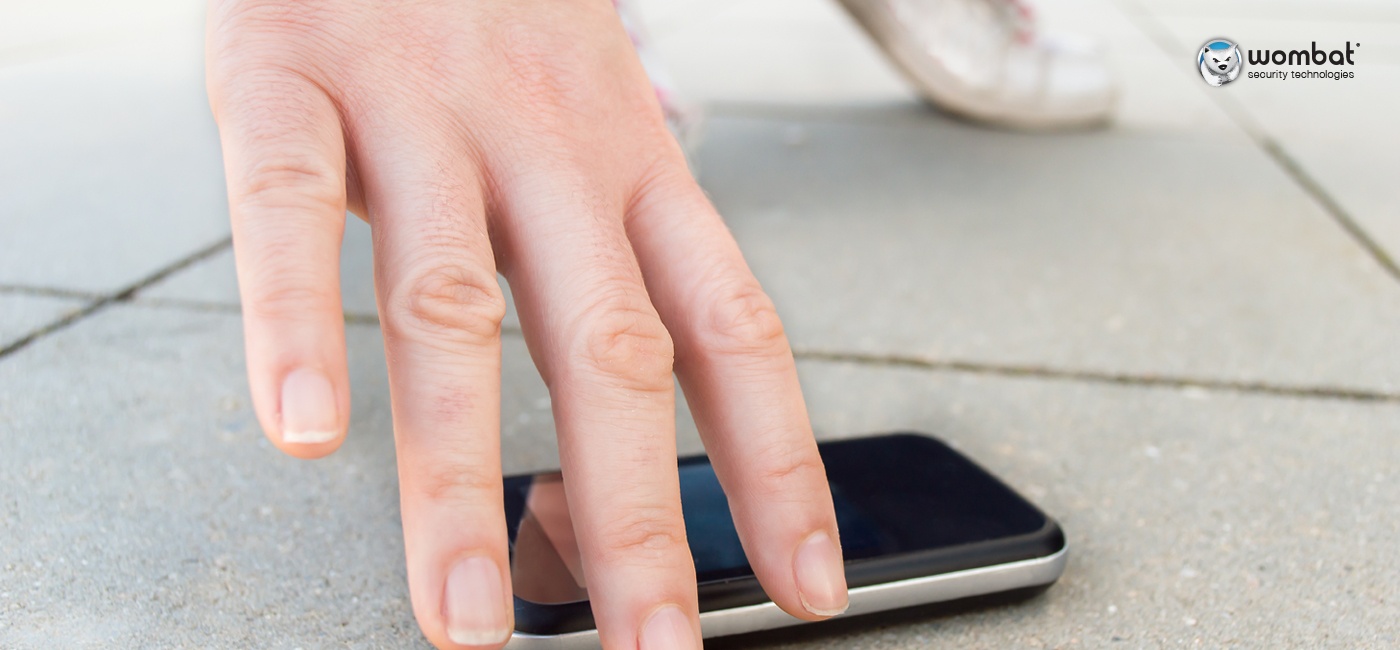
In 2012, Symantec conducted a mobile device experiment in North America known as the Smartphone Honey Stick Project. In 2014, Symantec Canada recreated the experiment in its home country. We wondered how things had changed since the first go-around and what mobile device users might now expect to happen should they lose their smartphone or tablet in a public place. The results may — or may not — surprise you.

A Little About the Honey Stick Project
The goal of both iterations of the Honey Stick Project was to find out what happens to mobile devices — and the data they hold — when they are lost and subsequently found by strangers. In the 2012 experiment, Symantec placed 50 preconfigured devices in public locations in five major cities across North America: New York City, Washington, D.C., Los Angeles, and San Francisco in the U.S., as well as Ottawa, Canada. For the 2014 follow-up, Symantec Canada “lost” 60 devices across six cities: Vancouver, Calgary, Toronto, Ottawa, Montreal, and Halifax.
In both experiments, the devices were preloaded with a collection of simulated corporate and personal data, along with remote monitoring capabilities that allowed researchers to track what happened to each device after it was found. Devices were not password-protected.
Here are a few key files, apps, and pieces of data that were included on each device:
- A Contacts app that clearly noted the phone number and email address of the phone’s “owner”
- Folder and files with enticing names like Passwords, HR Salaries, HR Cases, and Private Pix
- Personal and business apps like Webmail, Online Banking, Social Networking, Corporate Email, and Remote Admin
Several apps on each device also featured simulated login screens with prefilled user names and passwords to test whether “finders” would attempt to click through using the prefilled data.
Results: 2012 vs. 2014
In comparing the published results from the two experiments, there were plenty of similarities, but also some surprising differences. The table shows comparisons between several data points. (Note: With regard to app and file access, the 2012 study calculated percentages based on 47 devices. The 2014 study calculated percentages based on all 60 devices. It is not readily apparent in the 2012 documentation why the three devices were excluded from the calculations.)
| 2012 | 2014 | |
| Total devices that were accessed | 96% | 93% |
| Total finders who contacted owners to return the device | 50% | 55% |
| Devices accessed for personal apps | 89% | 83% |
| Devices accessed for corporate apps | 83% | 63% |
| Devices accessed for both personal and corporate apps | 70% | 58% |
| Devices on which the Saved Passwords file was accessed | 57% | 52% |
| Devices on which the Online Banking app was accessed | 43% | 35% |
| Devices on which the Social Networking app was accessed | 64% | 63% |
| Devices on which the Remote Admin app was accessed | 49% | 20% |
| Devices with attempts to click through “login or password reset” screens | 66% | 72% |
| Average time before an access attempt was made on a device | 10.2 hours | 0.75 hours |
| Median time before an access attempt was made on a device | 59 minutes | 1 hour |
Our Expert(-ish) Analysis
In reviewing the data, there are a number of possible conclusions you could draw. And you could also refute those possible conclusions. So, we decided to do both:
Possible Conclusion #1: Finders in 2014 Cared Less About Corporate Data Than Finders in 2012
Basis: Many of the results tied to personal apps and files were very close across both experiments, but the results tied to corporate files and apps were significantly different. For instance, a full 20% fewer devices accessed corporate apps in 2014 compared to 2012. In addition, the 49% of devices that accessed the Remote Admin app in 2012 significantly bested the 20% access rate in 2014.
Rebuttal: This doesn’t necessarily point to disinterest; it would also point to applicability. The average person, seeking relatable information, is more likely to look to personal email messages or social networking than they are to corporate apps. In the 2012 experiment, 28 of 47 devices accessed the personal webmail app; in 2014, 30 of 60 devices access that app. And the social networking access percentage only varied by 1% between the studies.
Looking beyond applicability, let’s talk high-value information: if the finder of a lost phone is looking to capitalize on the device and the data it holds, personal email and social media apps are more likely to deliver personally identifiable information and data related to banking, retail, and healthcare accounts.
Possible Conclusion #2: It Was More Dangerous to Lose a Device in 2012 Than It Was in 2014
Basis: In the 2012 study, more devices were accessed (96% vs. 93%), fewer devices were returned (25/50 vs. 33/60), and, in general, more finders attempted to access sensitive data across all categories, including financial information and stored passwords.
Rebuttal: Though the percentages seem to favor 2014 from a data security perspective, the differences between personal data access are not different enough to assume that lost devices were safer in 2014 than they were in 2012. In fact, there are two interesting differences in the 2014 study that point to the contrary:
- In 2014, more finders (72% vs. 66%) attempted to login to accounts using prefilled user names and passwords.
- The average time it took for a finder to access a lost phone was vastly shorter — to the tune of 9+ hours — in 2014 than in 2012. This points to a significant increase in vulnerability because, even if you would realize quickly that you’d left your phone behind, there’s not a lot of room for error.
Let’s also consider the difference in how percentages were calculated between the two studies. Remember that the 2012 study calculated app and file access percentages based on 47 (not 50) reported devices while the 2014 experiment took all 60 devices into account. Because the number of devices tracked wasn’t terribly high in either study, the exclusion is statistically significant. Here’s what happens if we recalculate the 2012 app access percentages using a divisor of 50 (instead of 47), which is more in line with the methodology used to calculate the percentages in the 2014 experiment:
| 2012 (original) | 2012 (recalculated) | 2014 (original) | |
| Devices on which the Saved Passwords file was accessed | 57% | 54% | 52% |
| Devices on which the Online Banking app was accessed | 43% | 40% | 35% |
| Devices on which the Social Networking app was accessed | 64% | 60% | 63% |
| Devices on which the Remote Admin app was accessed | 49% | 46% | 20% |
As you’ll see, the recalculated 2012 percentages decrease by 3% to 4% when all 50 devices are taken into account. Though there is still a significant gap with regard to some files and apps, others narrow considerably, and in the case of the Social Networking app access, the 2014 results take the lead over the 2012 results.
Possible Conclusion #3: Canadians Are More Considerate Than Americans
Basis: More finders offered to return devices in the Canadian-only 2014 experiment than in the U.S.-centric 2012 exercise.
Rebuttal: We can neither confirm nor refute this conclusion, eh?
The Bottom Line
All joking aside, it’s clear that physical security and use of passwords on mobile devices is of the utmost importance. Both versions of the Honey Stick Project show that if you lose your smartphone or tablet, you have only about a 50/50 shot at getting it back. They also show that, even if a finder does return a lost device, there’s more than a 90% chance that your data will be snooped on if you don't use a password.
To protect your smartphones and tablets, consider these tips from our interactive Mobile Device Security training module:
- Get serious about physical security – The simple act of keeping tabs on your devices and eliminating careless behaviors (e.g., setting your phone down on a counter rather than putting it away in a pocket or bag) can make all the difference.
- Add a strong password or lock – Without a locking mechanism, your data is free for the snooping for anyone who gets their hands on your device. At minimum, you should have a six-digit passcode on every smartphone and tablet. Longer alphanumeric passwords, complex swipe patterns, and biometrics can add even more security. (Just make sure you’re smart about how you create your passwords — and don’t share them with anyone, especially not on TV.)
- Enable remote security functionality – There are a number of mobile apps that allow you to track your phone’s location, remotely lock your device, and even remotely wipe data. Research your device’s capabilities and the best options for your operating system.
Want to see how we teach employees about mobile device security and help improve other cyber security behaviors? Try our training modules.


